How To Calculate Win Probability by Pipeline Stage Using HubSpot and Databox
Are your forecasts based on accurate data or more like best-guess assumptions? Learn how to use HubSpot and Databox to build data-driven win probabilities, improve sales forecasting in HubSpot, and strengthen both team coaching and sales forecast accuracy.
Validate and improve win probability by pipeline stage accuracy in sales.
Tory Ferrall, Director of Revenue Operations at Databox, walks through how her team used HubSpot and Databox to validate and improve win probability by pipeline stage accuracy in their sales process. She shares how new HubSpot properties and Databox data calculations helped them refine forecasts and coach reps more effectively.
Try it yourself
Check out our step-by-step tutorial to try building this dashboard for yourself or simply reach out to our team to get personalized help setting up your own dashboard.
See the full dashboard in action.
Explore the full dashboard the Databox RevOps team uses to calculate win probability by stage and by rep.
This dashboard includes custom metrics built from HubSpot’s pipeline data, powered by data calculations in Databox.
.
Explore more resources
Browse related templates, tutorials, and expert articles to help you improve forecast accuracy and team performance with HubSpot and Databox.


How to measure deal probability from HubSpot CRM with Databox
The challenge: Static deal stage probabilities
In HubSpot, each deal stage has a default win probability. But these are often set once based on intuition rather than data, and are rarely updated. That means HubSpot sales forecasts can be off, and managers may miss key opportunities to coach their team on weak spots in the pipeline.
Tory’s goal: Replace static, assumption-based probabilities with dynamic, data-driven ones that update automatically.
The solution: Gain more visibility using Datasets
Tory’s system is built in three parts:
- Count of Closed Won deals from each stage
- Using this metric recipe, Tory set up a metric to track the number of deals that entered a specific stage and eventually closed won.
- Count of all closed deals from each stage
- Next, she used this recipe to measure how many deals that entered the same stage ended up closing—whether won or lost.
- Probability to close calculation
- Finally, Tory combined the two metrics above to create a calculated metric (recipe here) that divides Closed Won by All Closed, returning the real win rate for that stage.
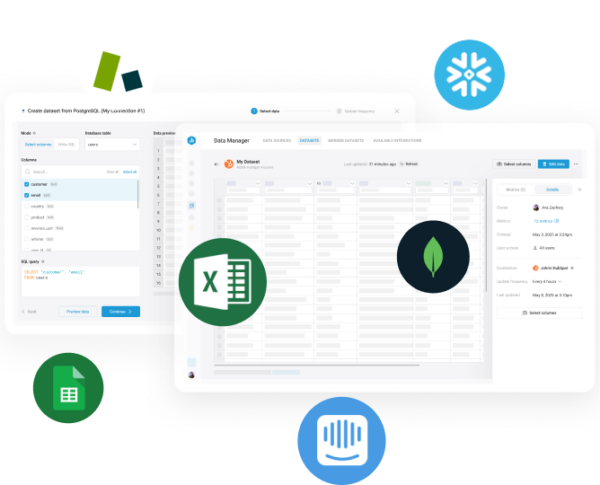
Why this works so well in Datasets
With Datasets, Tory can:
- Pull in Date Entered Deal Stage to accurately tie deals to the period they hit a specific stage.
- Filter by Deal Owner Name for rep-level analysis.
- Drill down into row-level data to view the actual deals behind the numbers.
- Use this data across multiple dashboards without rebuilding metrics.
The impact: From guessing to coaching with precision
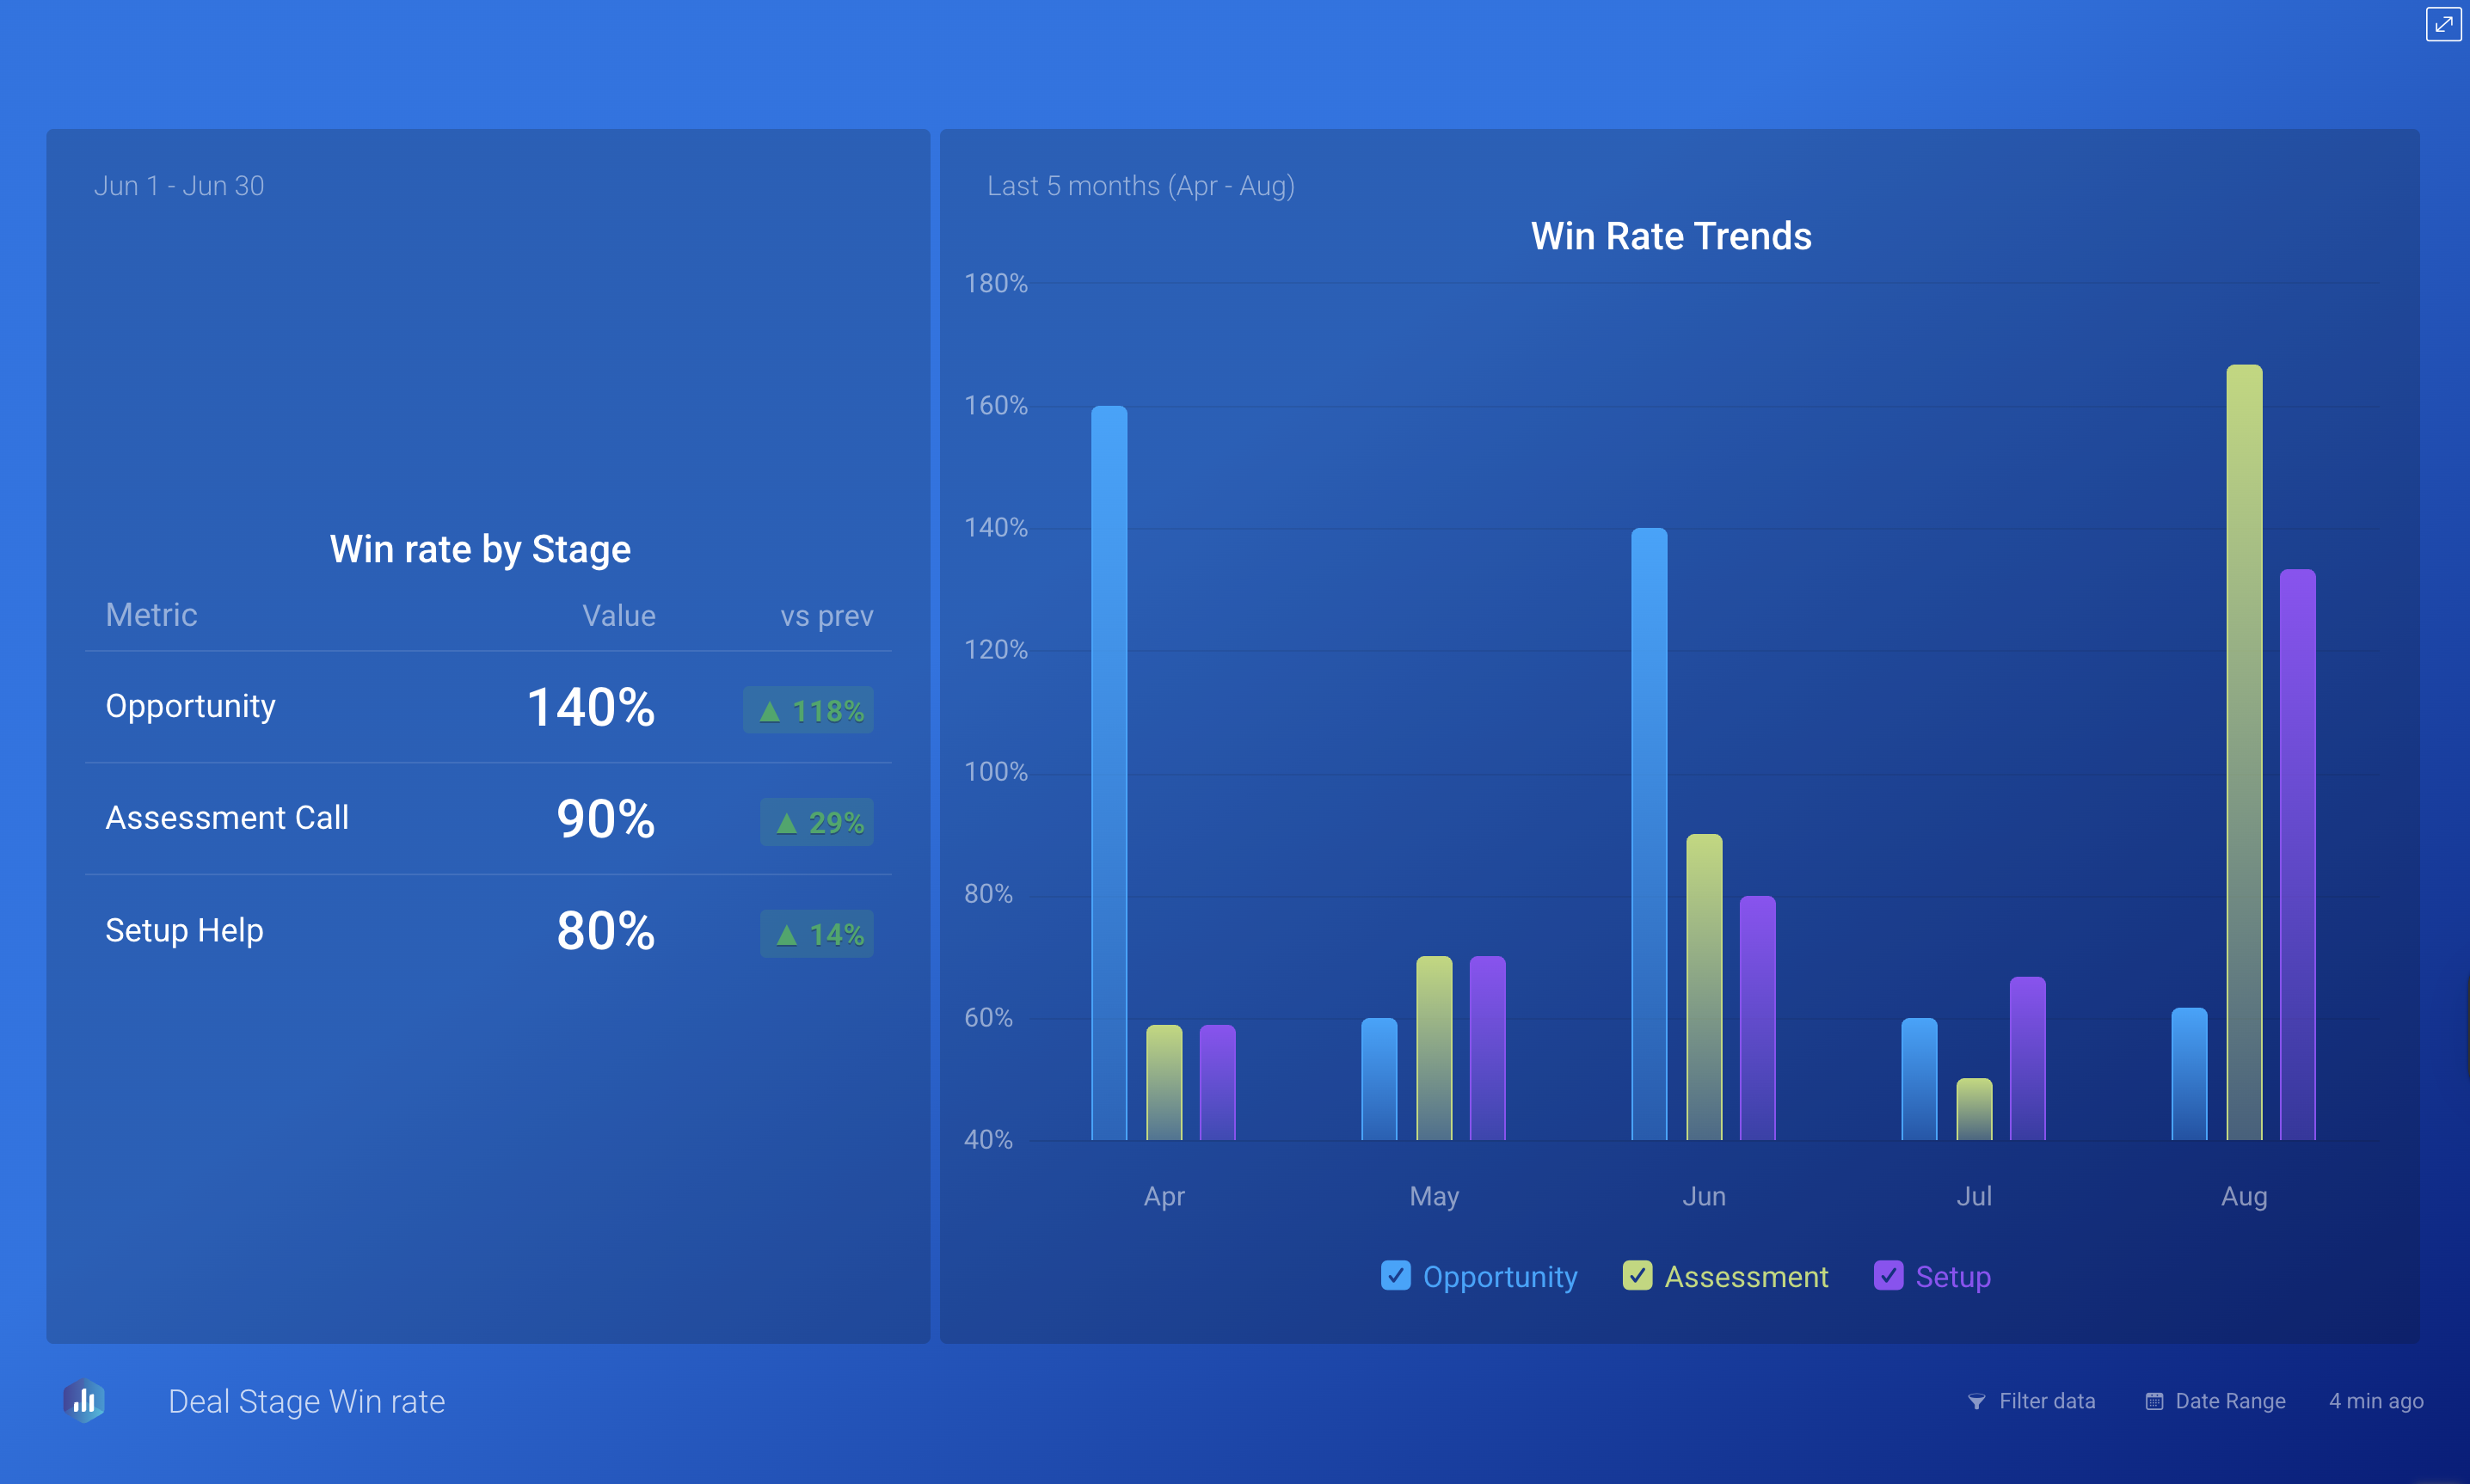
Before, deal stage probabilities were static and often inaccurate. Now, Tory’s dashboard updates in real time, showing:
- Which stages have the biggest drop-offs.
- How win rates change month-over-month.
- How each rep performs at each stage of the funnel.
For example, Tory noticed that the Setup Help stage had a much lower win rate than expected. Filtering by rep revealed that one team member was converting strongly early on but losing deals late in the cycle—pinpointing exactly where coaching was needed.
By moving from static stage probabilities to dataset-powered win rates, Tory now has:
- More accurate sales forecasts.
- Clearer insights into pipeline health.
- A scalable method for ongoing performance tracking.
Want help building your own version?
Want help building your own version?
Contact our team – we’ll build it for free.
FAQ
Why is win probability by pipeline stage important for sales forecasting?
Each sales pipeline stage reflects a different level of deal maturity. Calculating win probability by stage ensures your HubSpot forecasting reflects reality, helping leadership forecast revenue with more confidence and managers coach reps more effectively.
How do you report on close rates over time in HubSpot?
In HubSpot, you can use custom reports to report on close rates for a moment in time. Users encounter limitations without investing in Operations Hub or Datasets if trying to report on close rates over time and resort to manual exports to see close rates as a rolling metric. With Databox, this can be achieved in one single dashboard.
How do you calculate win probability in HubSpot?
By default, HubSpot assigns a static win probability to each deal stage in your pipeline. These can also be updated (manually or automatically), but users complain about gaps and inaccuracies if prospects have not completed every stage in linear order. With Databox, a combination of calculated metrics allows accurate reporting on win rates by stage.
How is this win rate formula calculated?
This is a modified win rate based on Closed-Won divided by all Closed deals that entered a stage during a selected period.
Can I use this dashboard to coach individual reps?
Yes. You can filter metrics by rep using the “Deal Owner” dimension and identify coaching opportunities by comparing stage-level performance.
Make better decisions,
together, faster
Product
Compare
Databox Inc.
HQ: Boston, MA, USA
Modern BI for teams that needs answers now
Databox Inc.
HQ: Boston, MA, USA

Modern BI for teams that needs answers now


Product
Compare