How to track sales funnel conversions with HubSpot & Databox
If you’re dealing with longer sales cycles, tracking leads and closed deals in the same month can be misleading. That’s why Alex Lee, Senior Director of Business Analytics at Intellect, built a custom lead funnel in Databox that reflects actual sales conversion rates by offsetting reporting periods (something that’s impossible to do natively in HubSpot!).
Create custom funnel reports in a single dashboard
Alex Lee of Intellect walks through how his team uses Databox to build a lead funnel that aligns with their sales cycle. He demonstrates how to track leads over a rolling 90-day period, measure each funnel stage, and identify which lead sources drive the biggest and fastest deals.
Try it yourself
Check out our step-by-step tutorial to try building this dashboard for yourself or simply reach out to our team to get personalized help setting up your own dashboard.
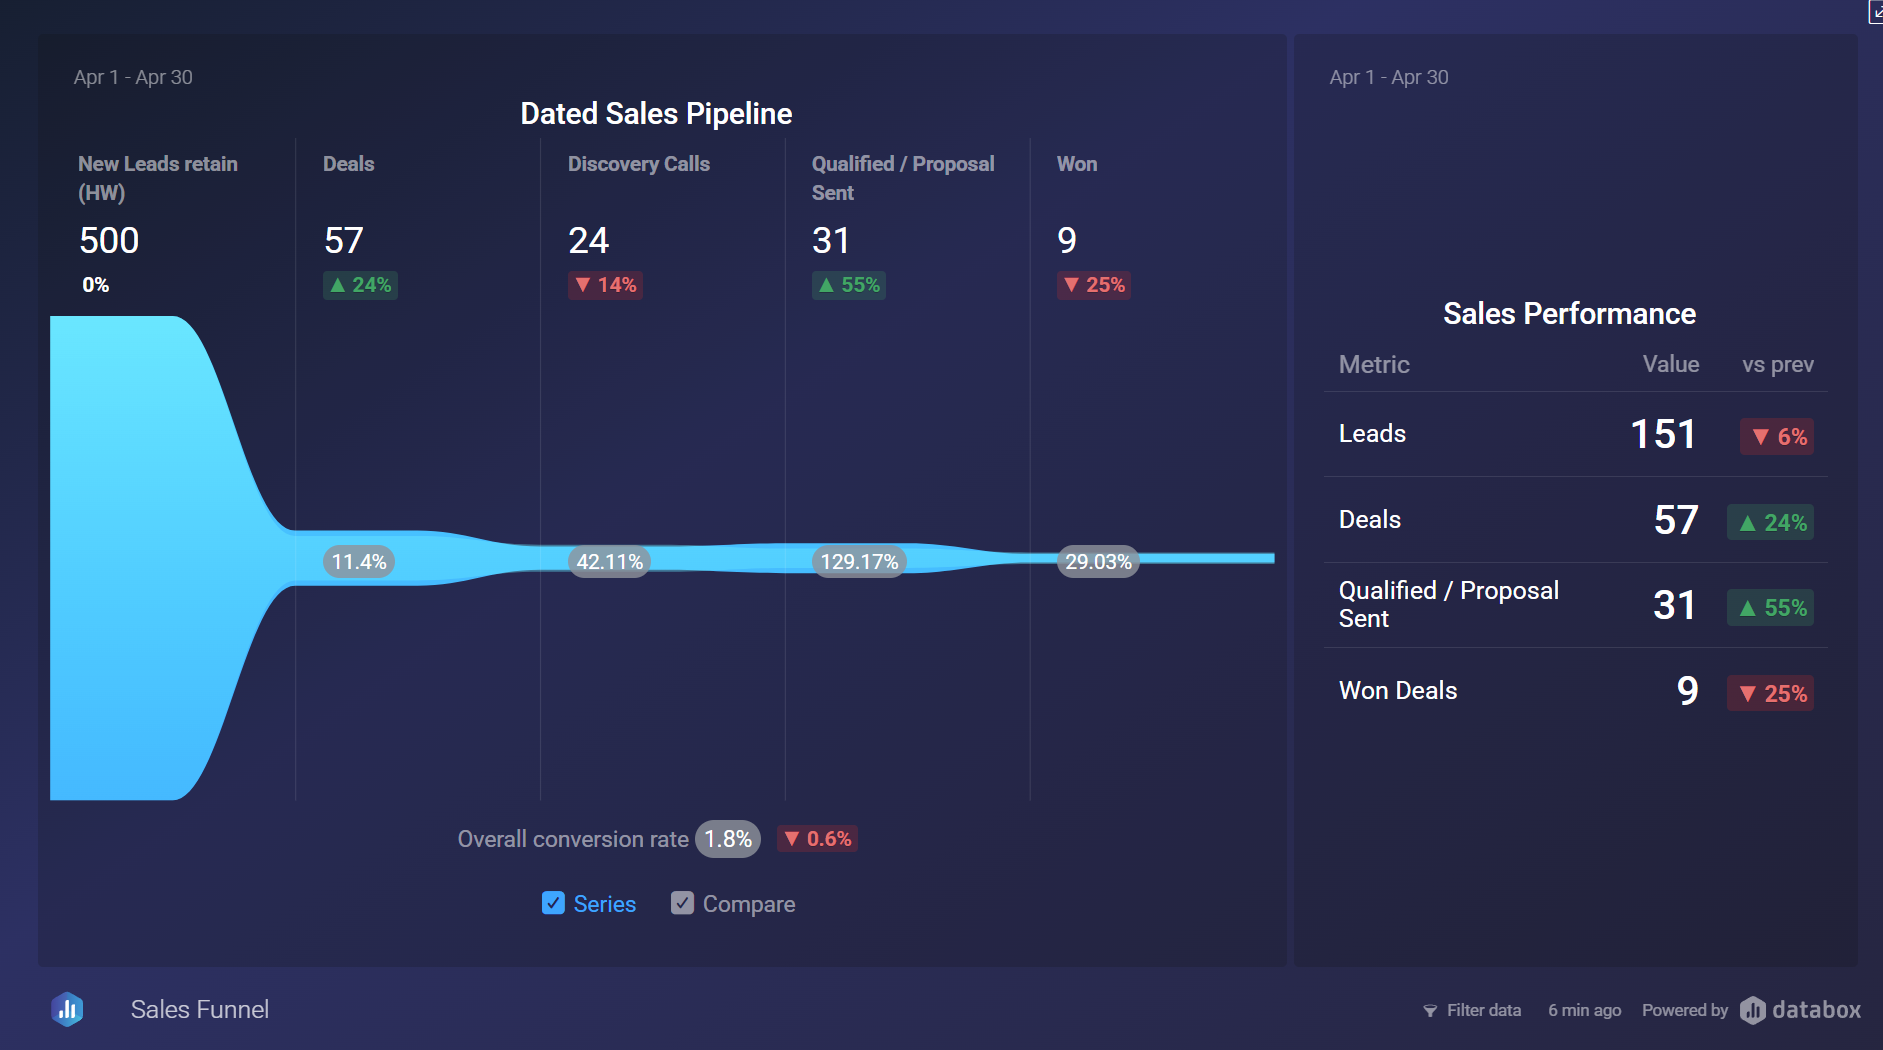
See the full dashboard in action.
Explore the dashboard Intellect uses to track how leads from 90 days ago convert into deals today.
This dashboard includes calculated metrics, discovery call engagement, and lead source filtering across a rolling timeline.
Explore more resources
Browse related templates, tutorials, and expert articles to help you improve forecast accuracy and team performance with HubSpot and Databox.
How to build this dashboard
To replicate the rolling funnel setup shared by Intellect, follow this step-by-step guide from the Databox Community:
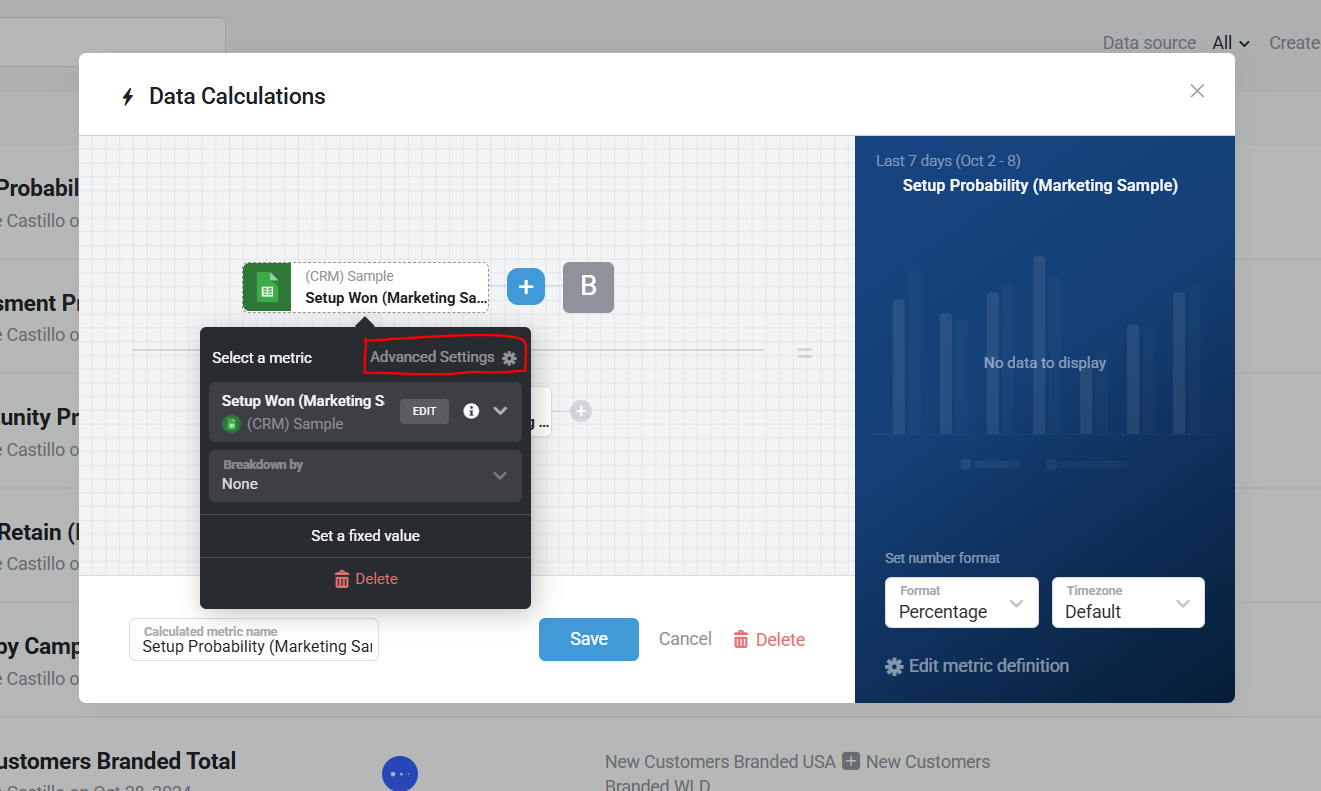
How to retain date range settings in a Calculated Metric
- Navigate to Calculated Metrics and create a Calculated Metric.
- Add both Metrics you want to compare (e.g., Leads and Closed Won Deals)
- Click on Advanced Settings.
- Toggle on “Retain metric settings for all date ranges”.
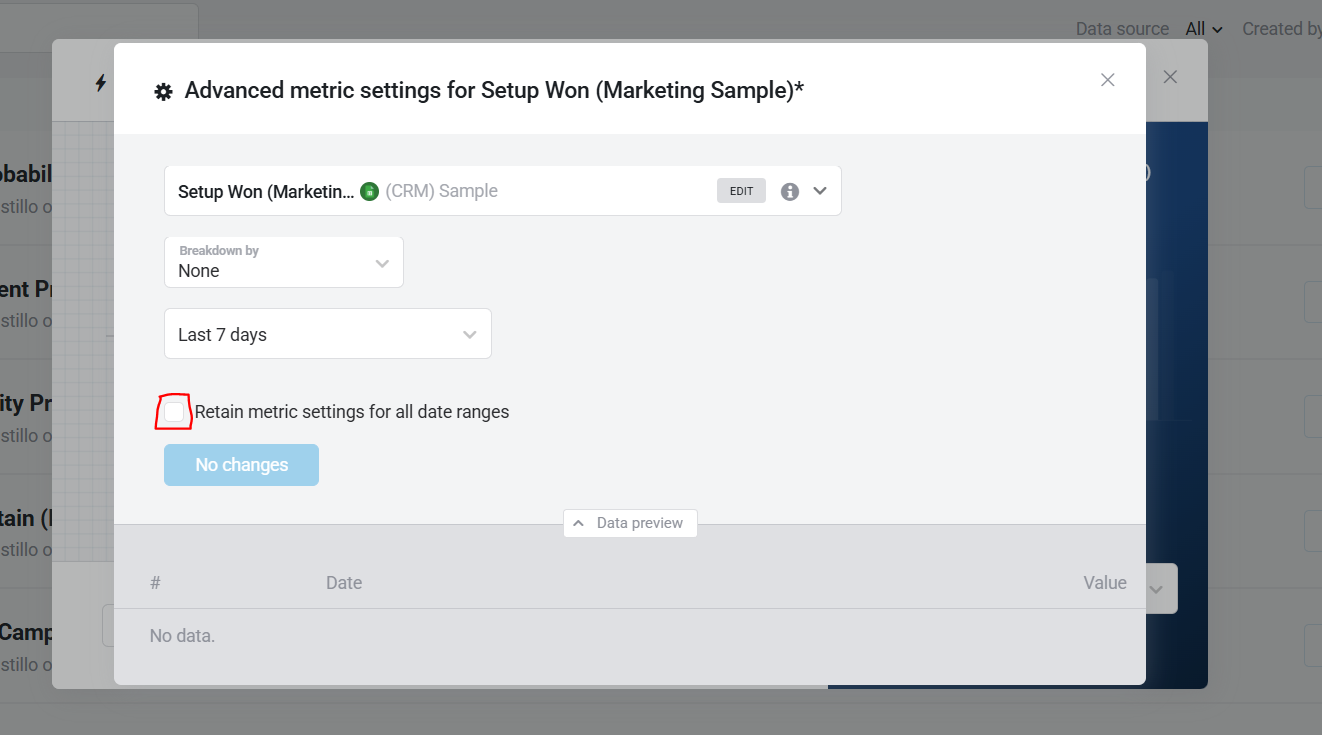
This allows each Metric in your calculation to keep its original time frame—even if you apply a different global date range to your Databoard.
Example use case:
Let’s say Alex’ sales cycle is 90 days:
- Set your Leads Metric to use the last 90 days.
- Set your Closed Won Deals Metric to use month-to-date.
- Use the formula: Closed Won Deals / Leads.
This will calculate a more realistic conversion rate based on how long deals typically take to close
Using pipeline visualization with custom date ranges
With pipeline visualization, Alex can compare drop-off and conversion rates across the buyer’s journey and easily pinpoint where prospects disengage.
Next to that, he can:
- Create a one-metric calculation for your Leads Metric (to lock in the 90-day date range).
- Use a standard Closed Won Metric for the current month.
- Add both to the pipeline to preserve the correct context.
This setup ensures that his pipeline stages reflect his actual sales cycle while still enabling meaningful conversion rate analysis.
For more on Data Calculations, visit: How to create a Data Calculation.
Want help building your own version?
Want help building your own version?
Contact our team – we’ll build it for free.
FAQ
Can I build this funnel using HubSpot or Salesforce data?
Yes, Databox integrates with both platforms and allows custom filtering by lead creation date, deal stages, and more.
Why are my conversion numbers different between HubSpot and Google Ads?
This is caused by attribution model differences. HubSpot may use different attribution windows or models than Google Ads. Ensure both platforms use the same attribution model and verify proper conversion tracking setup.
What if my sales cycle is shorter or longer than 90 days?
You can customize the rolling window to match your unique cycle: 30, 60, 120+ days. The rolling window technique adapts to your specific sales velocity.
How do I fix data mapping issues between HubSpot and Salesforce?
Review field mappings carefully, ensure property types are compatible, map Salesforce Record IDs to HubSpot properties, and set sync rules to prevent conflicts.
Can I add my own funnel stages like “Discovery Call” or “Proposal Sent”?
Absolutely. You can create calculated metrics for any stage you track in your CRM using HubSpot’s Lead Object and Databox’s Metric Builder.
What should I do if my funnel data looks inconsistent between systems?
Check data sync settings, ensure all systems use the same date ranges and filters, verify timezone settings, and confirm field mappings are aligned.
How do I handle leads that convert much faster or slower than my rolling window?
Use multiple attribution models simultaneously with different rolling windows (30, 60, 90 days) or implement time-decay attribution models.
Can I track leads from multiple traffic sources in the same funnel?
Yes, you can filter by traffic source using UTM parameters consistently across campaigns and ensure your CRM captures original source data properly.
Make better decisions,
together, faster
Product
Compare
Databox Inc.
HQ: Boston, MA, USA
Modern BI for teams that needs answers now
Databox Inc.
HQ: Boston, MA, USA

Modern BI for teams that needs answers now


Product
Compare