How To Track Webinar Analytics Across Zoom & HubSpot with Databox
If webinars are part of your marketing strategy, tracking their real performance can be difficult. Zoom and HubSpot each provide fragments of data—but without an integrated view, it’s hard to connect Zoom webinar analytics to ROI. In this how-to guide, you’ll learn how to set up a comprehensive webinar analytics dashboard using HubSpot, Zoom, and Databox. From webinar attendance tracking to lead conversion and engagement trends, you’ll be able to report on webinar performance, all in one place.
Measure the business impact of every webinar you run.
Ali Schwanke, CEO of Simple Strat, shows how her team uses Databox dashboards to merge Zoom and HubSpot data, segment audiences, track first conversions, and visualize performance over time. See how to overcome HubSpot’s reporting gaps and turn webinar analytics into a strategic advantage.
Try it yourself
Check out our step-by-step tutorial to try building this dashboard for yourself or simply reach out to our team to get personalized help setting up your own dashboard.
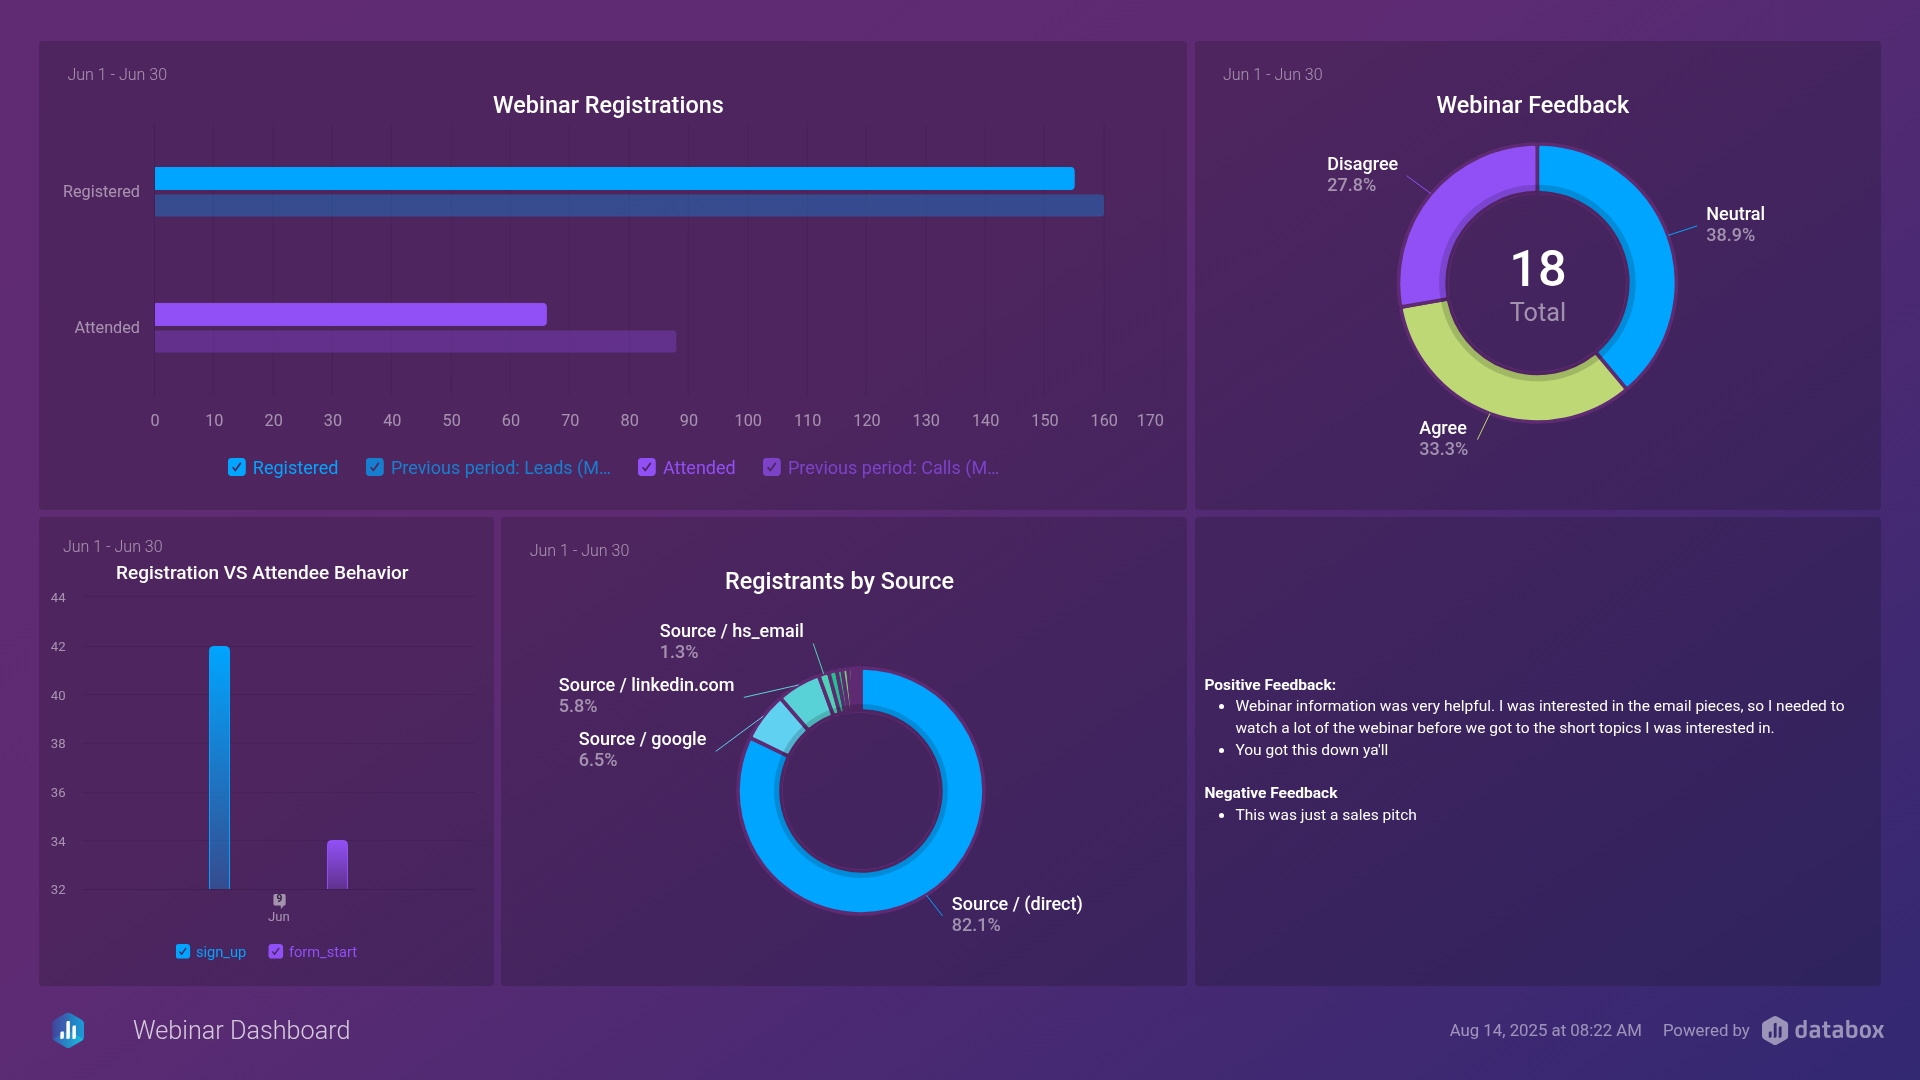
See the full dashboard in action.
Explore the full dashboard that Simple Strat uses to track monthly webinar KPIs.
This dashboard includes data from Zoom (registrations, survey responses) with lead lifecycle data from HubSpot to get the fuller picture of webinar impact.
.
Explore more resources
Browse related templates, tutorials, and expert articles to help you get more out of your HubSpot reporting.

Tutorial: Customize this Zoom webinar reporting dashboard with Databox
Here’s how to recreate Ali Schwanke’s webinar dashboard:
Webinar Registrations:
Create three contact lists in HubSpot—one for each behavior:
- Registered
- Attended
- First-time conversion
Once your workflows are set up, use Metric Builder for HubSpot Marketing to visualize the data. Alternatively, you can also use HubSpot Datasets for deeper reporting.
Registration vs. Attendance Behavior:
Build two Custom Metrics using Count of Contacts to track webinar engagement.
1. Attended at least one webinar
- Value: Count of Contacts
- Date: Last Activity Date (or a recent date property)
- Dimensions: Original Source, Original source drill-down 1, Original source drill-down 2
- Filter: Zoom webinars attended is greater than 0
2. Registered for at least one Zoom webinar
- Value: Count of Contacts
- Date: Last Activity Date
- Dimensions: Original Source, Original source drill-down 1, Original source drill-down 2
- Filter: Zoom webinar registrations is greater than 0
To focus on a specific webinar, break down the metric by Original source drill-down 2 and filter by the ID of the webinar.
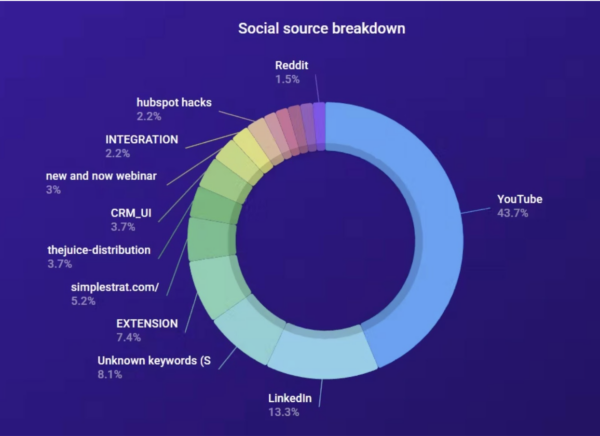
Social Source Breakdown
Track the source of webinar registrations:
- Value: Count of Contacts
- Date: Last Activity Date
- Dimension: Original Source
- Filter: Webinar Registration Behavior
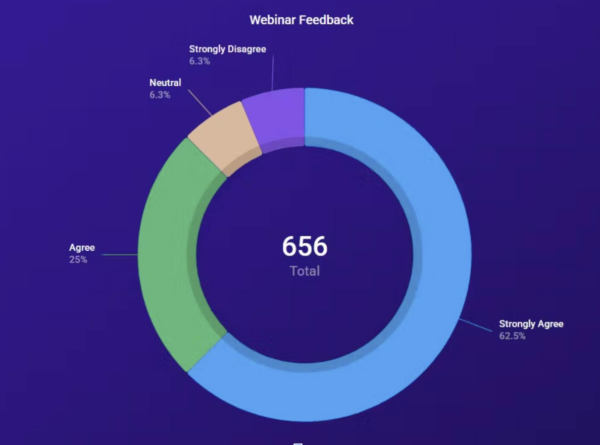
Webinar Feedback (Static)
Zoom data export is required here.
- Value: Count of Meeting IDs
- Date: Leave blank
- Dimension: Column with the NPS question (e.g. satisfaction score or sentiment tag)
Since no date is available, this will behave as a static metric and should be updated manually when new feedback is available.
Customize this Zoom webinar reporting dashboard with Databox
Want help building your own version?
Contact our team – we’ll build it for free.
FAQ
Can I track webinar performance in HubSpot without Databox?
Yes, HubSpot can capture basic Zoom webinar data like registrations, attendees, and no-shows. However, this data is spread across multiple properties and views, and advanced insights (like first conversions, Q&A responses, and month-over-month trends) require manual workarounds. Databox centralizes all of this into one easy-to-use dashboard.
Do I need a developer to set up webinar reporting with Databox?
No. Most of the setup can be done using HubSpot lists, Zoom’s integration, and Databox’s built-in data connectors. For more advanced fields, you may need to create custom properties or upload CSV data, but no coding is required.
Can I see which channel drove the most webinar signups?
Absolutely. By combining HubSpot source data with Zoom registration lists in Databox, you can see which channels (like YouTube, LinkedIn, or Google) delivered the most registrations — and how many of those became first-time conversions.
How often is webinar data updated in Databox?
HubSpot and Zoom integrations update automatically based on your sync settings. In most cases, data refreshes daily, but you can trigger manual updates if you need real-time insights before or after a webinar.
Can I compare the results from different webinars?
Yes. In Databox, you can use custom metrics to look at different webinars based on HubSpot lists. You can create a bar chart to compare each month’s results or build a table displaying the results.
Make better decisions,
together, faster
Product
Compare
Databox Inc.
HQ: Boston, MA, USA
Modern BI for teams that needs answers now
Databox Inc.
HQ: Boston, MA, USA

Modern BI for teams that needs answers now


Product
Compare