Use this easy-to-use, customizable QuickBooks Profit & Loss (P&L) Dashboard to analyze key financial metrics, including total income, expenses, and net profit. This dashboard tracks revenue sources, expense categories, gross profit margin, and net profit margin, helping you make data-driven decisions to improve your business’s financial health. It integrates with QuickBooks, ensuring seamless data tracking and in-depth analysis for better insights.
If you don't use QuickBooks, you can pull data from any of our 130+ one-click, native integrations or from spreadsheets, databases and other APIs.
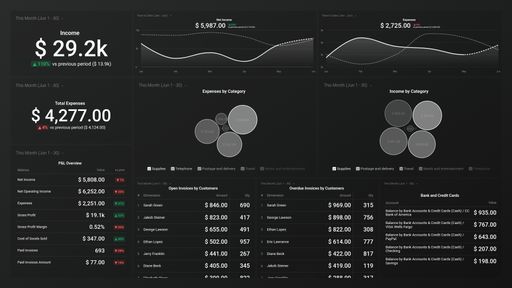
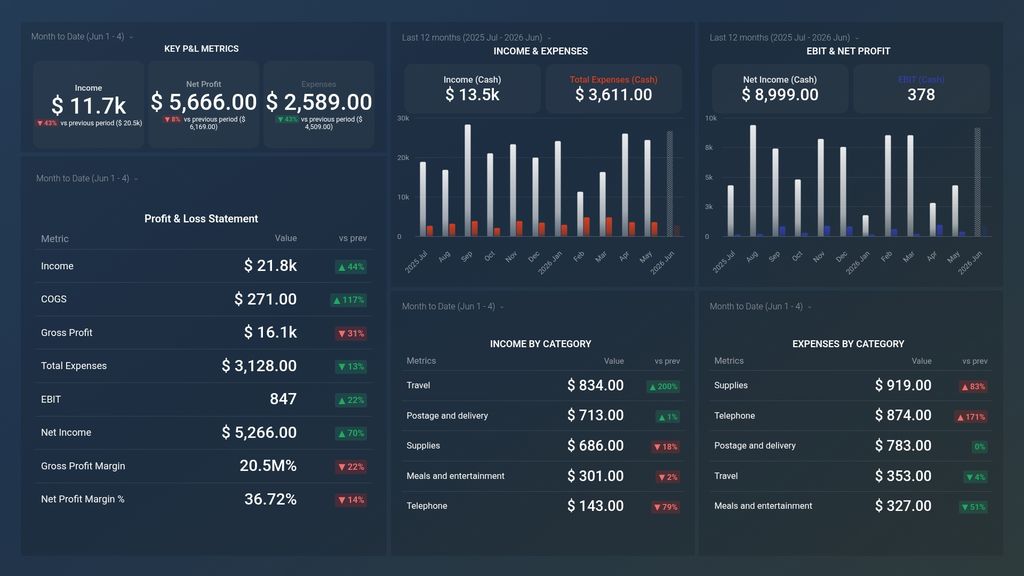
Total Expenses (Cash) by Category is a metric that shows the amount of money spent on each expense category in cash terms over a specific period in QuickBooks.
The Income (Cash) by Category metric in QuickBooks shows the total revenue received within a specific category over a selected time period, providing a clear picture of the sources of income for a business.
Quickbooks dashboard template provides you with insights about cash flow, bank accounts, sales and expenses enterred in Quickbooks to stay on top of your business.
Lead with confidence using our "SaaS Leadership Dashboard" powered by Stripe and QuickBooks. Get real-time insights into financial and operational metrics for informed decision-making. Elevate your SaaS business effortlessly.
Empower your e-commerce leadership with Databox's integrated Shopify, QuickBooks, and Google Analytics 4 dashboard. Gain insights into Sales Funnel, Performance, Profit & Loss, and Cash Flow metrics, including Gross Sales, Orders, Revenue, Expenses,
The QuickBooks Balance Sheet Overview dashboard provides a real-time snapshot of assets, liabilities, and equity. It includes key financial metrics like liquidity, efficiency, solvency. Ideal for monitoring financial stability and performance.
Sometimes, you'll want to dive deeper into performance. When you need to customize this template (or any other dashboard) to include different metrics, add metrics from different sources, etc., you can do so by using Databox's Dashboard Designer.
The Designer allows you to easily drag-and-drop metrics and visualizations from any data source right into your dashboard.
Everyone starts with a free 14-day trial of our Growth plan, with access to all advanced analytics features. Then choose any plan that best suits your needs.
Creating your account...