Uses one-click integrations:
-
 Appfigures
If you don't use Appfigures, you can pull data from any of our 130+ one-click, native integrations or from spreadsheets, databases and other APIs.
Try this dashboard for free
Appfigures metrics included in this template
-
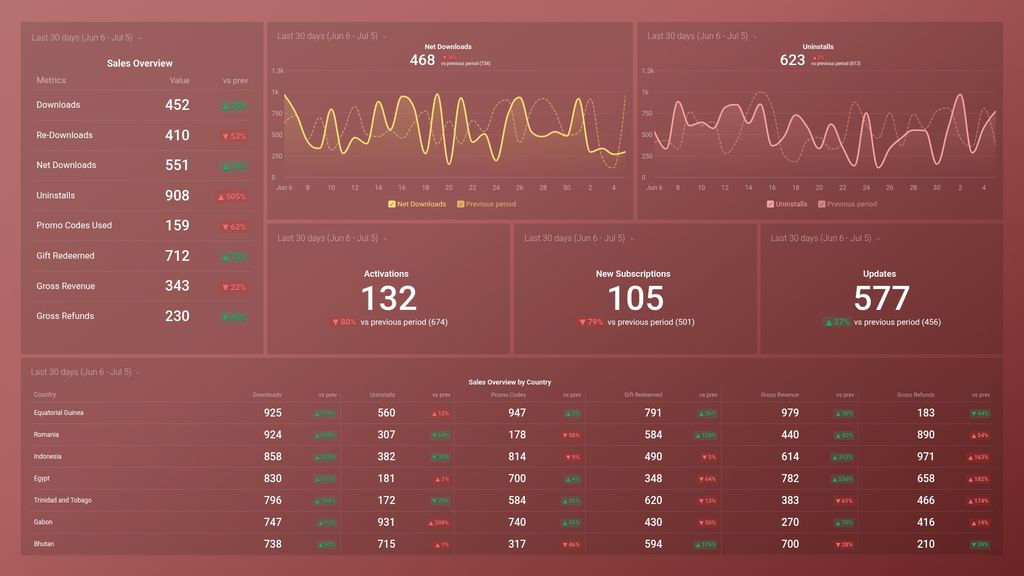
Downloads
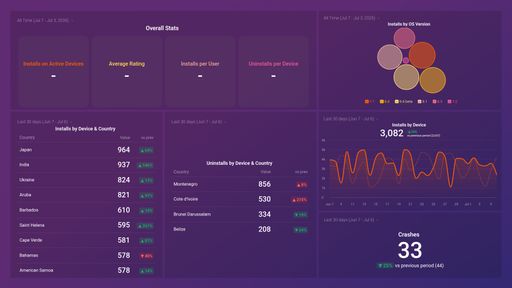
The Downloads metric measures the total number of times an app has been downloaded from the app store to a user's device.
-
Downloads by Country
Downloads by Country is a metric that tracks the number of app or game downloads in each country, providing insights into the app's popularity and reach.
-
Gift Redeemed
The Gift Redeemed metric in AppFigures tracks the number of times a gift or promo code has been redeemed by users in your app or in-app purchase.
-
Gift Redeemed by Country
The Gift Redeemed by Country metric shows the number of gift codes that have been redeemed in each country in which your app is available.
-
Gross Refunds
The Gross Refunds metric in AppFigures represents the total amount of money refunded by all customers within a specified time frame for an app or game.
-
Gross Refunds by Country
Gross Refunds by Country is a metric that shows the total amount of money refunded for app purchases in each country where the app is sold, before any fees or deductions are taken into account.
-
Gross Revenue
Gross Revenue is a key metric used to measure the total income generated from sales of an app, before any deductions such as commission fees or taxes.
-
Gross Revenue by Country
The Gross Revenue by Country metric in AppFigures shows the total revenue generated by your app in each country where it's available.
-
Net Downloads
The Net Downloads metric in AppFigures refers to the total number of downloads of an app or game across all platforms, including refunds or reinstalls.
-
Promo Codes Used
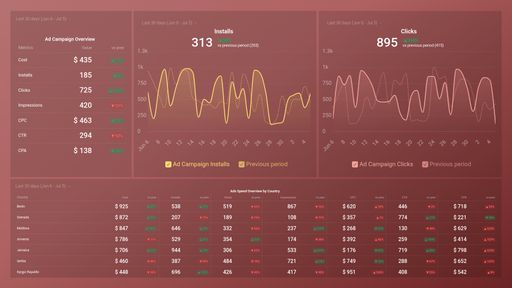
The Promo Codes Used metric in AppFigures tracks the number of promotional codes that have been redeemed by users for a given app or version, allowing developers to gauge the effectiveness of their promotional campaigns.
-
Promo Codes Used by Country
The Promo Codes Used by Country metric in AppFigures provides an overview of the number of promotional codes used in different countries for a specific app. This data can be helpful for evaluating the effectiveness of promotional campaigns across different regions and adjusting marketing strategies accordingly.
-
Re-Downloads
Re-Downloads measures the number of times an app is downloaded again by a user who had previously downloaded and possibly uninstalled the same app.
-
Uninstalls
The Uninstalls metric counts the number of times users have uninstalled your app. It helps you track the retention rate and user satisfaction.
-
Uninstalls by Country
Uninstalls by Country is a metric that tracks the number of times your app was uninstalled by users in specific countries, helping you identify retention issues or potential regional user trends.
-
Updates
The Updates metric in AppFigures measures the frequency and volume of app updates released by developers, providing insights into their commitment to maintaining and improving their app over time.
-
Activations
Activations represent the total number of times an app has been installed and opened for the first time on a device. It helps to track the app's user acquisition and adoption rate over time.
-
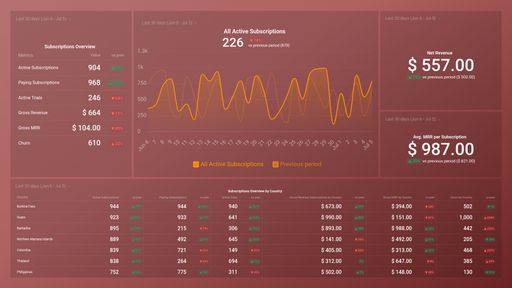
New Subscriptions
New Subscriptions is a metric that shows the number of new users who have subscribed to a particular app or service during a specific time period.