Uses one-click integrations:
-
 Appfigures
If you don't use Appfigures, you can pull data from any of our 130+ one-click, native integrations or from spreadsheets, databases and other APIs.
Try this dashboard for free
Appfigures metrics included in this template
-
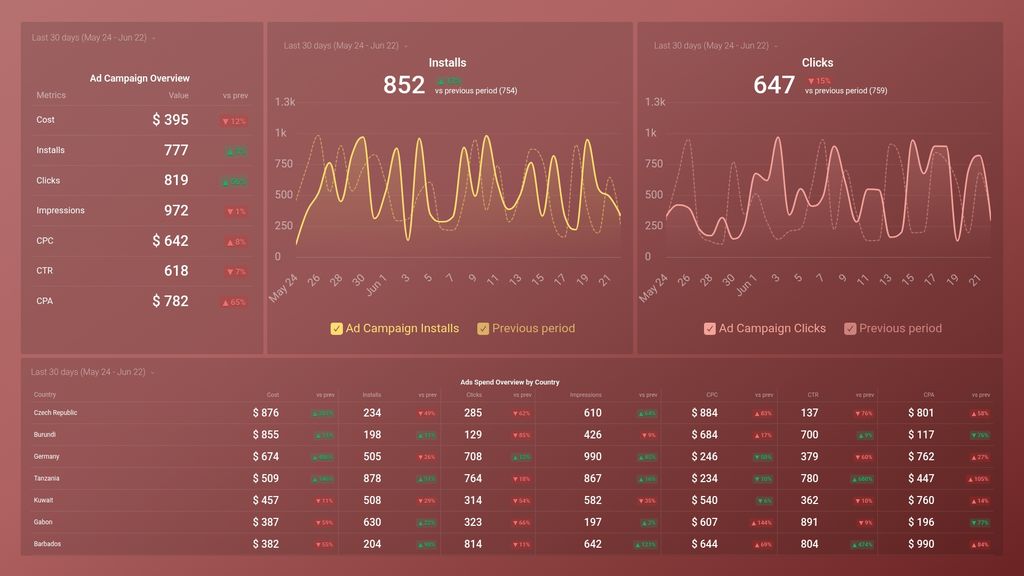
Ad Campaign Clicks
Ad Campaign Clicks measures the total number of clicks generated by an advertising campaign. This metric helps to evaluate the effectiveness of the campaign and identify opportunities for optimization.
-
Ad Campaign Clicks by Country
Ad Campaign Clicks by Country is a metric that measures the number of clicks on your ad campaign from each country where it was displayed, helping you identify the most effective regions for your ad targeting strategy.
-
Ad Campaign Cost
Ad Campaign Cost is the total amount spent on advertising within a specific campaign. This includes all costs, such as ad creation, placement, and distribution across various channels and platforms.
-
Ad Campaign Cost by Country
The Ad Campaign Cost by Country metric shows the cost of advertising campaigns broken down by individual countries, helping businesses determine which countries are the most cost-effective for advertising and where they should focus their marketing efforts.
-
Ad Campaign CPA
Ad Campaign CPA (Cost Per Acquisition) represents the cost incurred for each successful app install or action attributed to a specific advertising campaign. It helps measure ad effectiveness and optimize campaign budget allocation.
-
Ad Campaign CPA by Country
The Ad Campaign CPA by Country is a metric that helps measure the cost per acquisition (CPA) of an advertising campaign in different countries. It provides insights into which countries are the most cost-effective for a campaign and can help optimize marketing strategies.
-
Ad Campaign CPC
Ad Campaign CPC (Cost per Click) is the average amount of money spent per click on an ad, calculated by dividing the total cost of the campaign by the number of clicks generated. It helps measure ad efficiency and inform future budgeting decisions.
-
Ad Campaign CPC by Country
The Ad Campaign CPC by Country metric in AppFigures shows the average cost per click (CPC) for each country where your ad campaign is running. This allows you to compare the effectiveness of your campaign across different regions and adjust your strategy accordingly.
-
Ad Campaign CTR
CTR (Click-Through Rate) measures the percentage of users who clicked on an ad out of the total number who viewed it. It helps evaluate ad effectiveness and indicates how well its resonating with the audience.
-
Ad Campaign CTR by Country
The Ad Campaign CTR by Country metric measures the click-through rate (CTR) of your mobile app ad campaigns in different countries. It helps you evaluate the effectiveness of your ads in specific regions and optimize your advertising strategy accordingly.
-
Ad Campaign Impressions
Ad Campaign Impressions is a metric that measures how many times your ad has been displayed to users on various platforms, such as social media or search engines. It indicates how many people have potentially seen your ad.
-
Ad Campaign Impressions by Country
The Ad Campaign Impressions by Country metric tracks how many times an ad has been displayed to users in different countries. This helps businesses analyze the reach and effectiveness of their advertising efforts in specific regions.
-
Ad Campaign Installs
Ad Campaign Installs are the number of app installs resulting from specific advertising campaigns on various platforms, such as social media or search engines.
-
Ad Campaign Installs by Country
The Ad Campaign Installs by Country metric shows the number of app installs generated by specific ad campaigns within each country.