AI-powered analytics for teams
that need answers now
Turn business performance data into clear answers your team can understand, explain, and act on – instantly.
Explore Key Features


20,000+ scaling businesses
manage their performance with Databox
increase in sales YoY
decrease in overall reporting costs
reduction in time spent creating reports
Get answers
from your data instantly
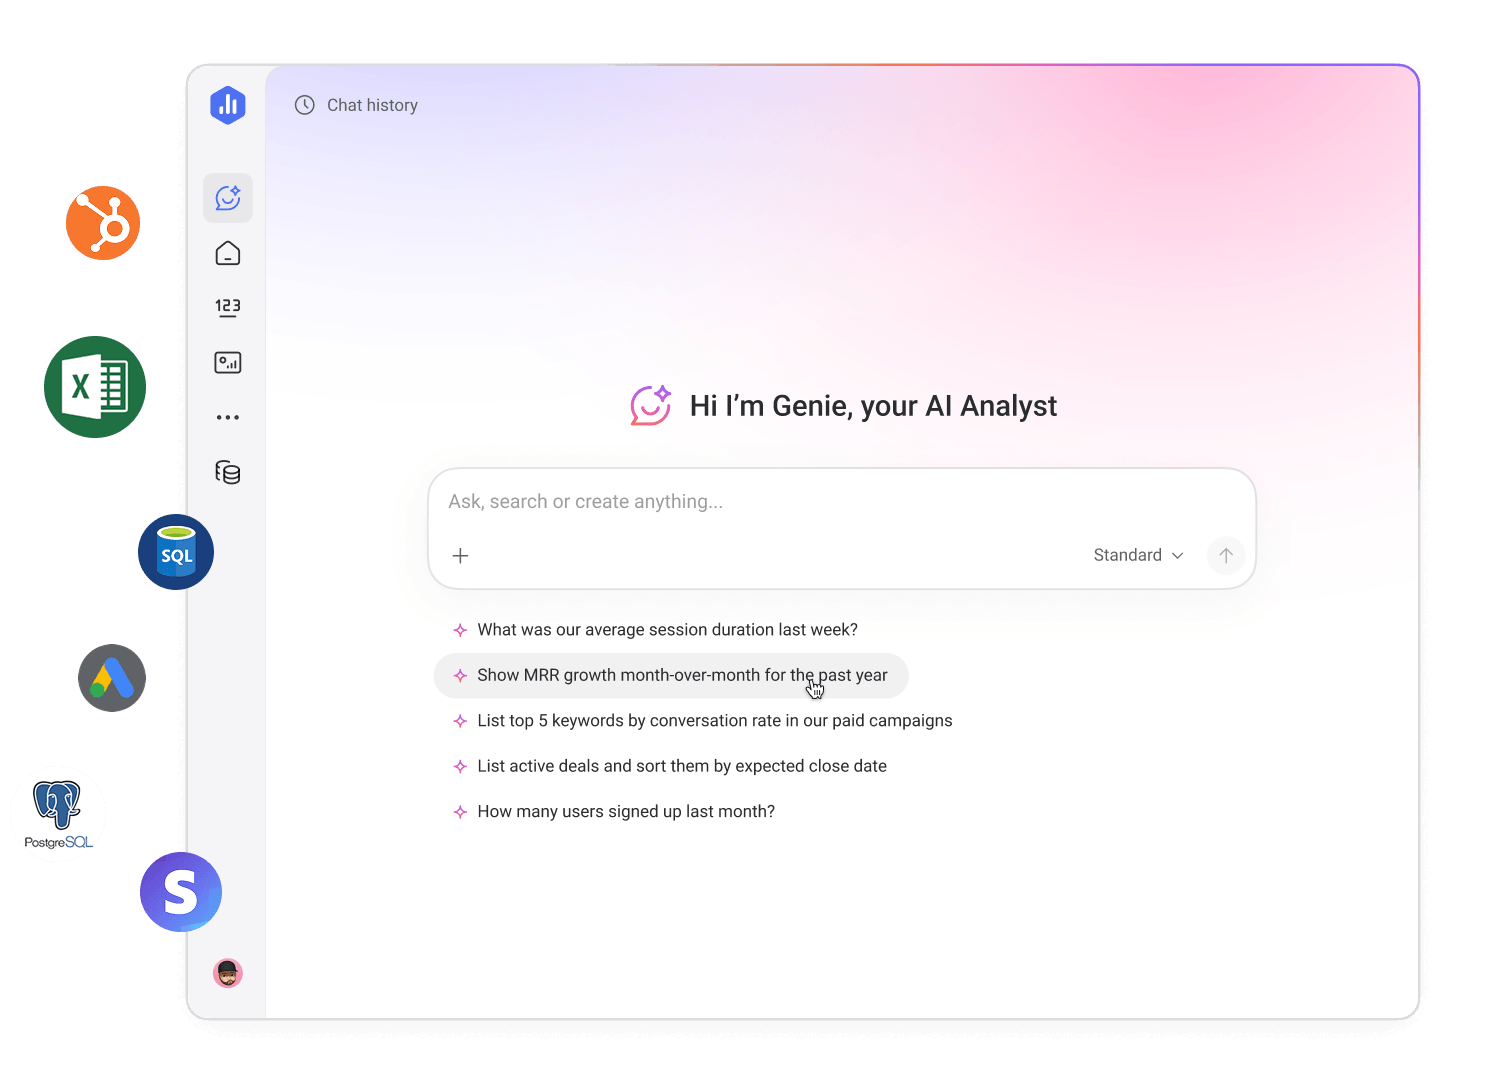
Getting answers from your data used to take hours. Not anymore. With Genie, our AI analyst, you can ask a question and get a clear answer in seconds.
Ask business performance questions in plain language
Create metrics and dashboards with a prompt
Understand what's driving changes in your metrics
Train Genie your business context
From data to decisions –
without the wait.
When business performance questions come up, it\’s hard to get a clear, confident answer – fast. Pulling numbers together from multiple systems. Spinning up a dashboard. Waiting on analysts.
Databox is a business intelligence and analytics platform that helps teams understand performance in the moment – so they can manage performance deliberately, not reactively.
Make better decisions, together
Send the right data to the right people, in the right format, at the right time.
Databox helps our team stay aligned by sharing up-to-date performance metrics daily. This has made our team meetings much more productive and data-driven.
Measure what matters most
Focus on what matters most to your growth.
Databox is an absolute must in my tech stack. It allows me to track metrics that matter to me in a way that other reporting tools don't.
Draw better conclusions
Know the why behind the number.
You can connect different data sources to gain context across your KPIs. Seeing data in one place brings clarity to performance.
Enable “DIY BI”
Empower your entire team to self-serve data.
[Databox lets us] empower team members from different departments to explore data without having to wait on someone technical.
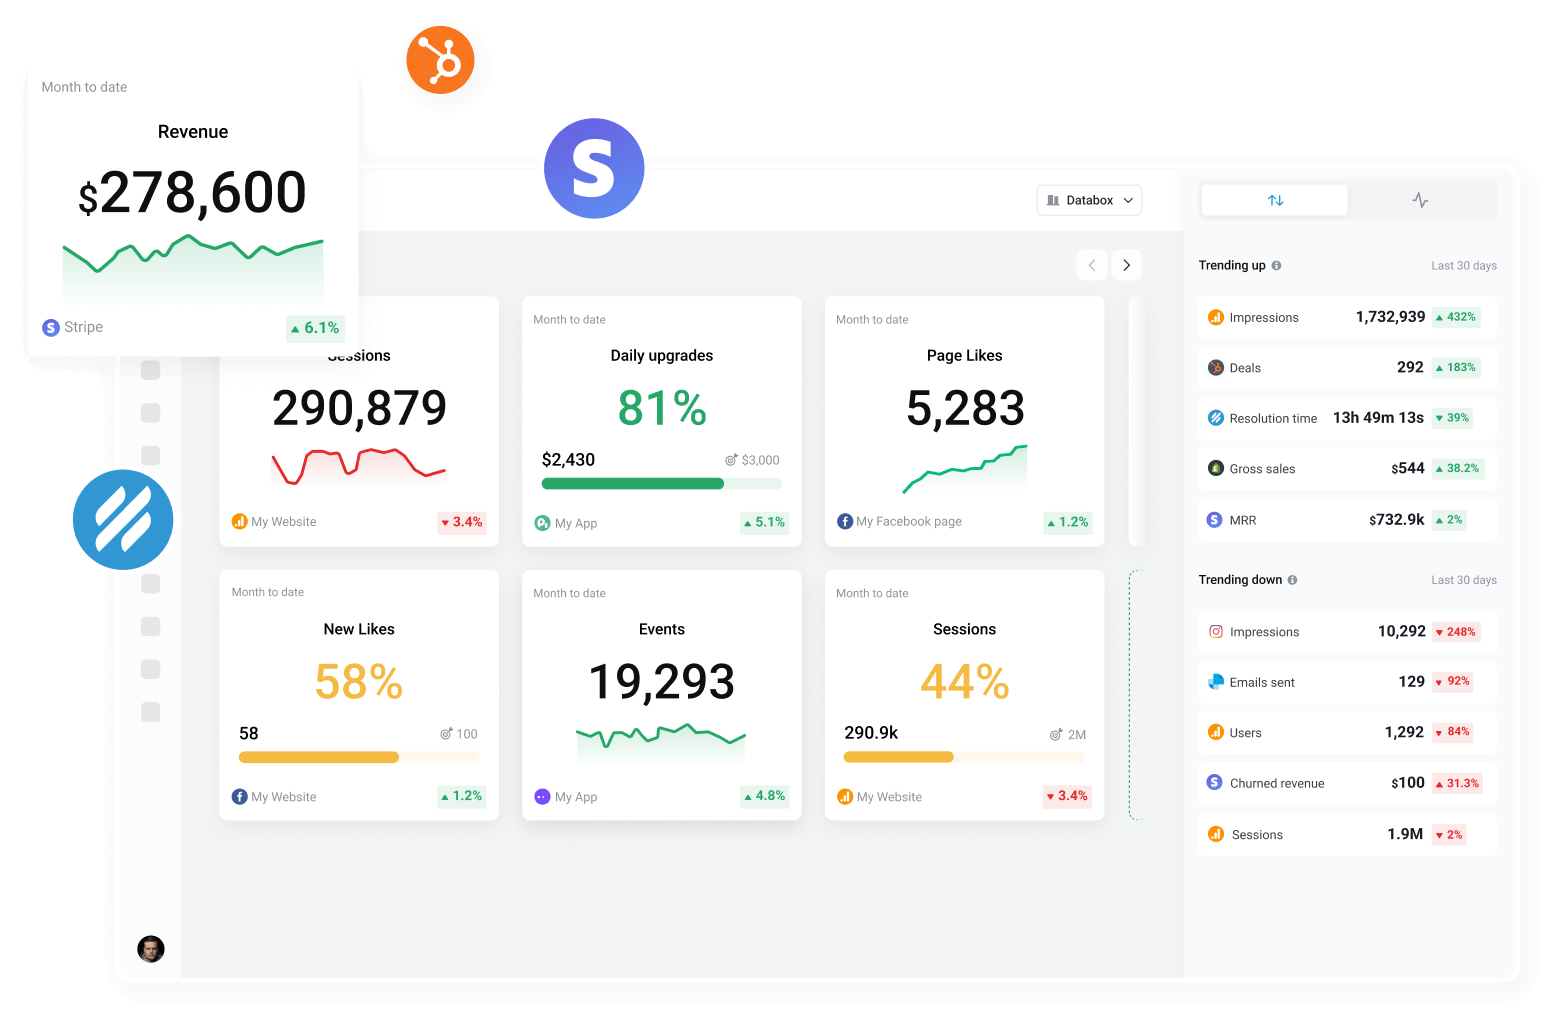
Provide clarity at a glance
Understand your performance instantly.
[Databox] helps us analyze and visualize data in ways that make it more digestible for everyone.
Share versions and visions
Move faster without second-guessing the source or meaning.
[Databox helps us] combine all our key metrics into a single location—without needing to worry about which version of the data is right.
Analytics that answer back
No more waiting or digging through your business performance data. Talk directly to your data and go from data to decisions, at the speed of your questions.
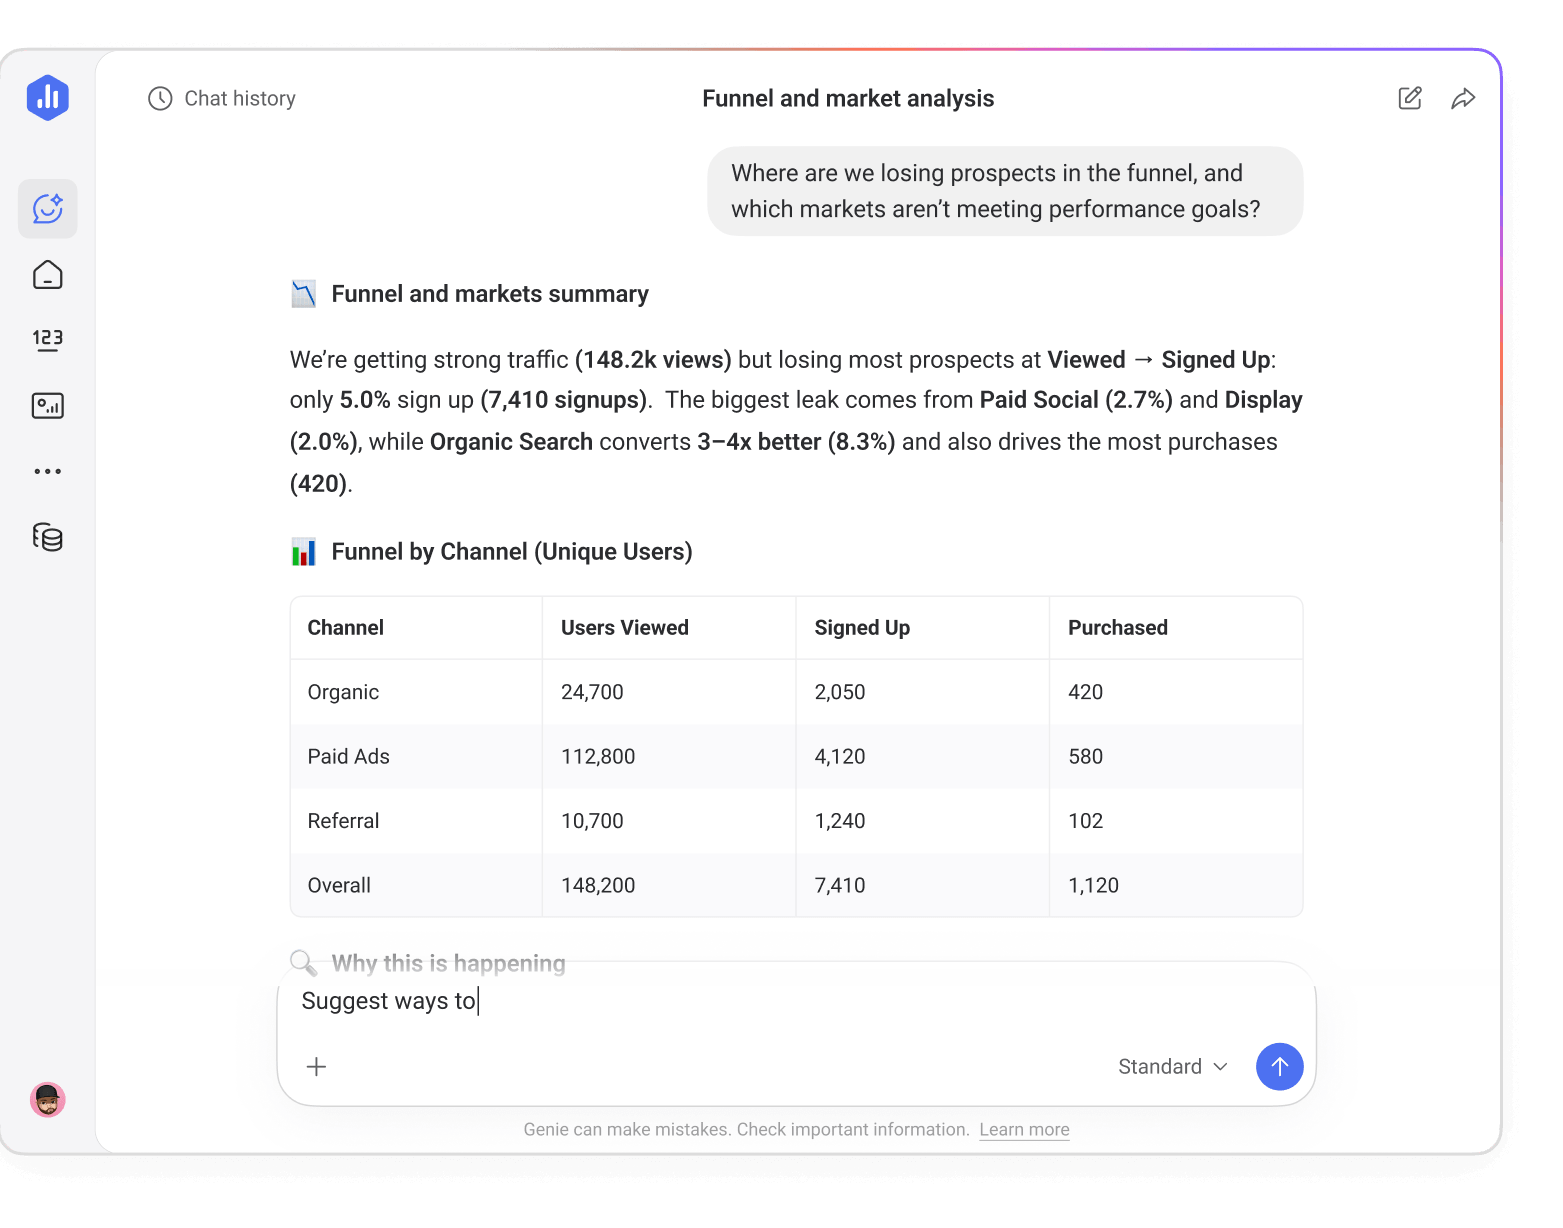
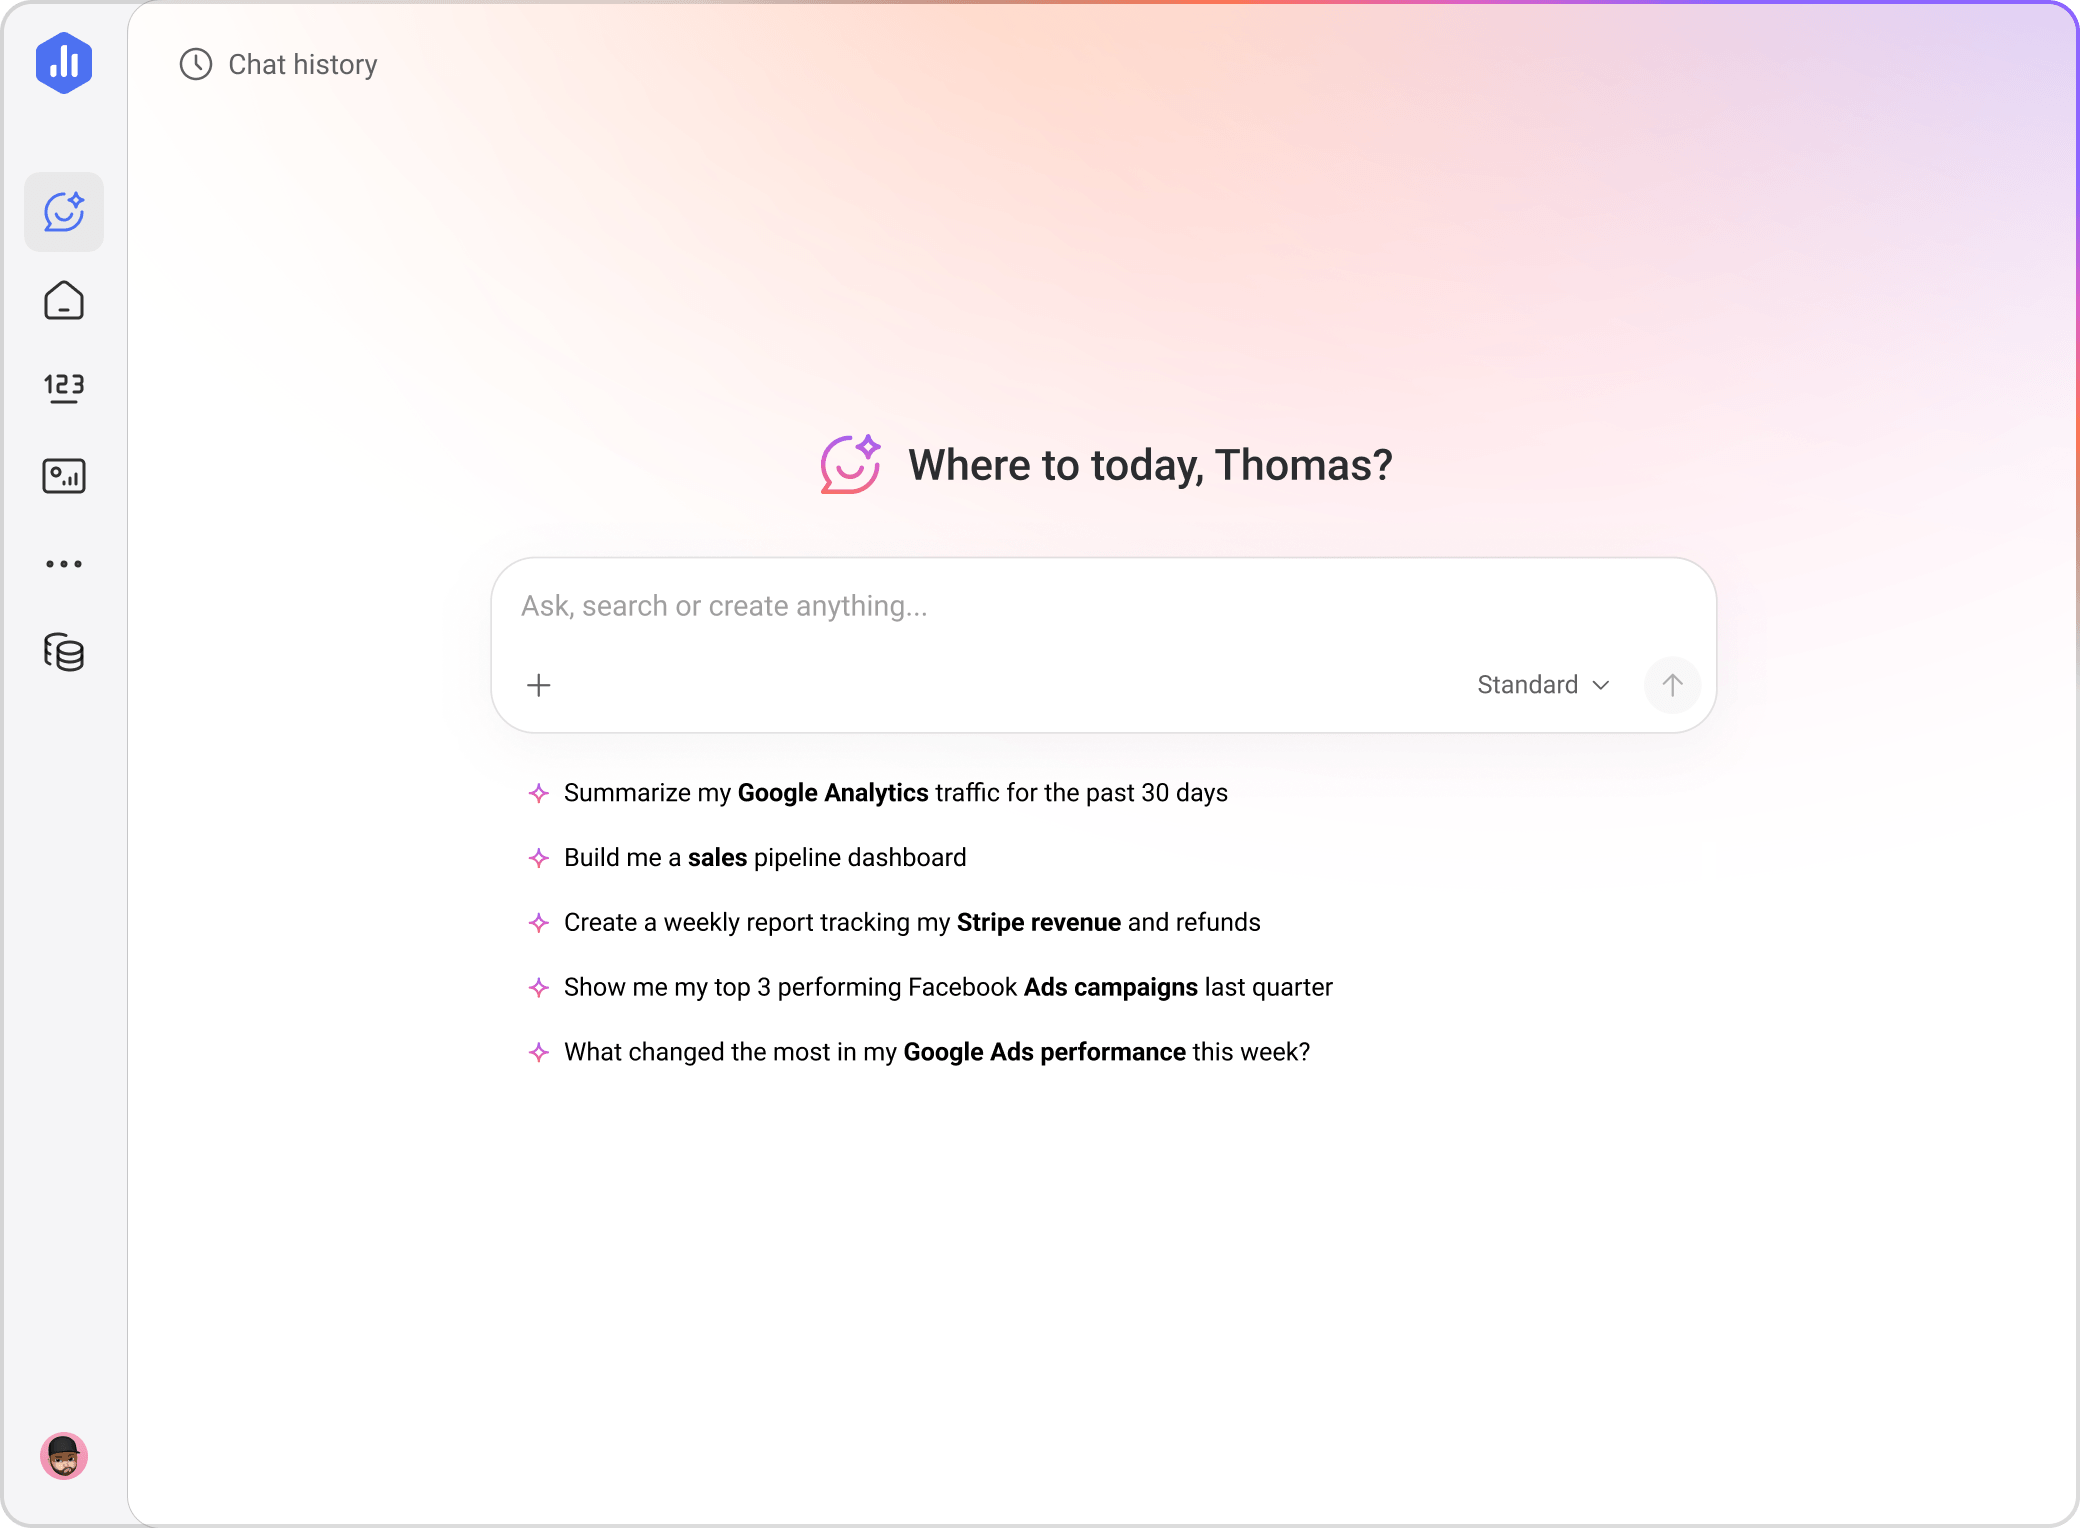
Genie, the AI Analyst
Get answers from your data in seconds.
How it works
Ask Genie your questions in everyday conversational language, and watch it answer performance questions, create metrics, and build dashboards – all grounded in your business data and context.
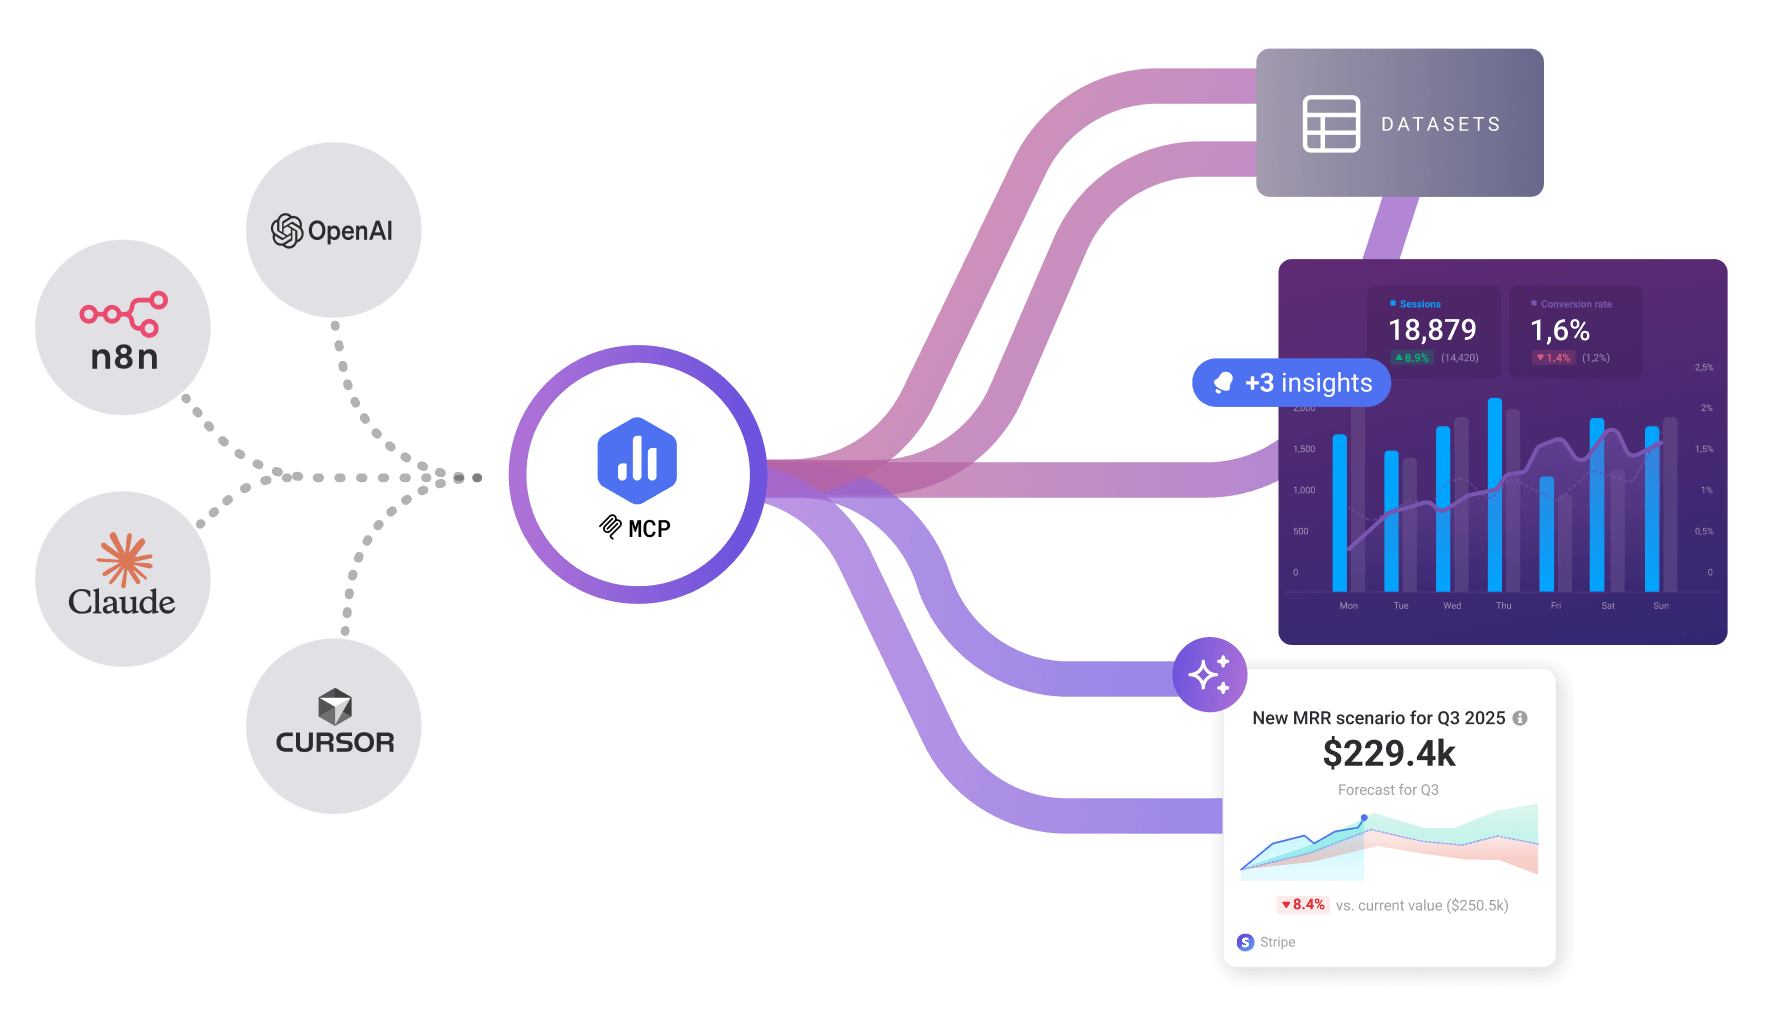
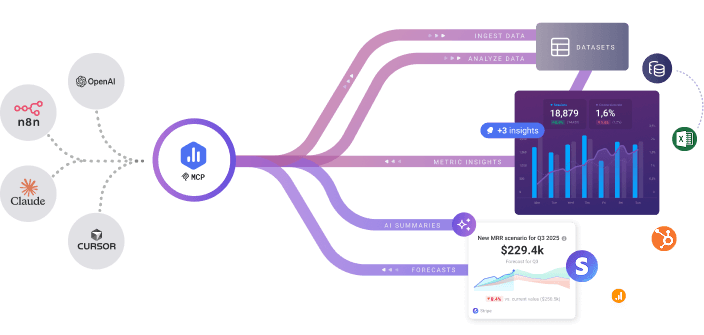
Databox MCP
Connect Databox to your AI tools.
How it works
Connect Databox to your LLMs and automation tools to turn performance insights into recurring summaries, updates, follow-ups, and actions that run automatically.
See performance clearly
Understand what's working (or not) and why. Share performance summaries and drill-downs in a way that can be easily understood by any stakeholder.
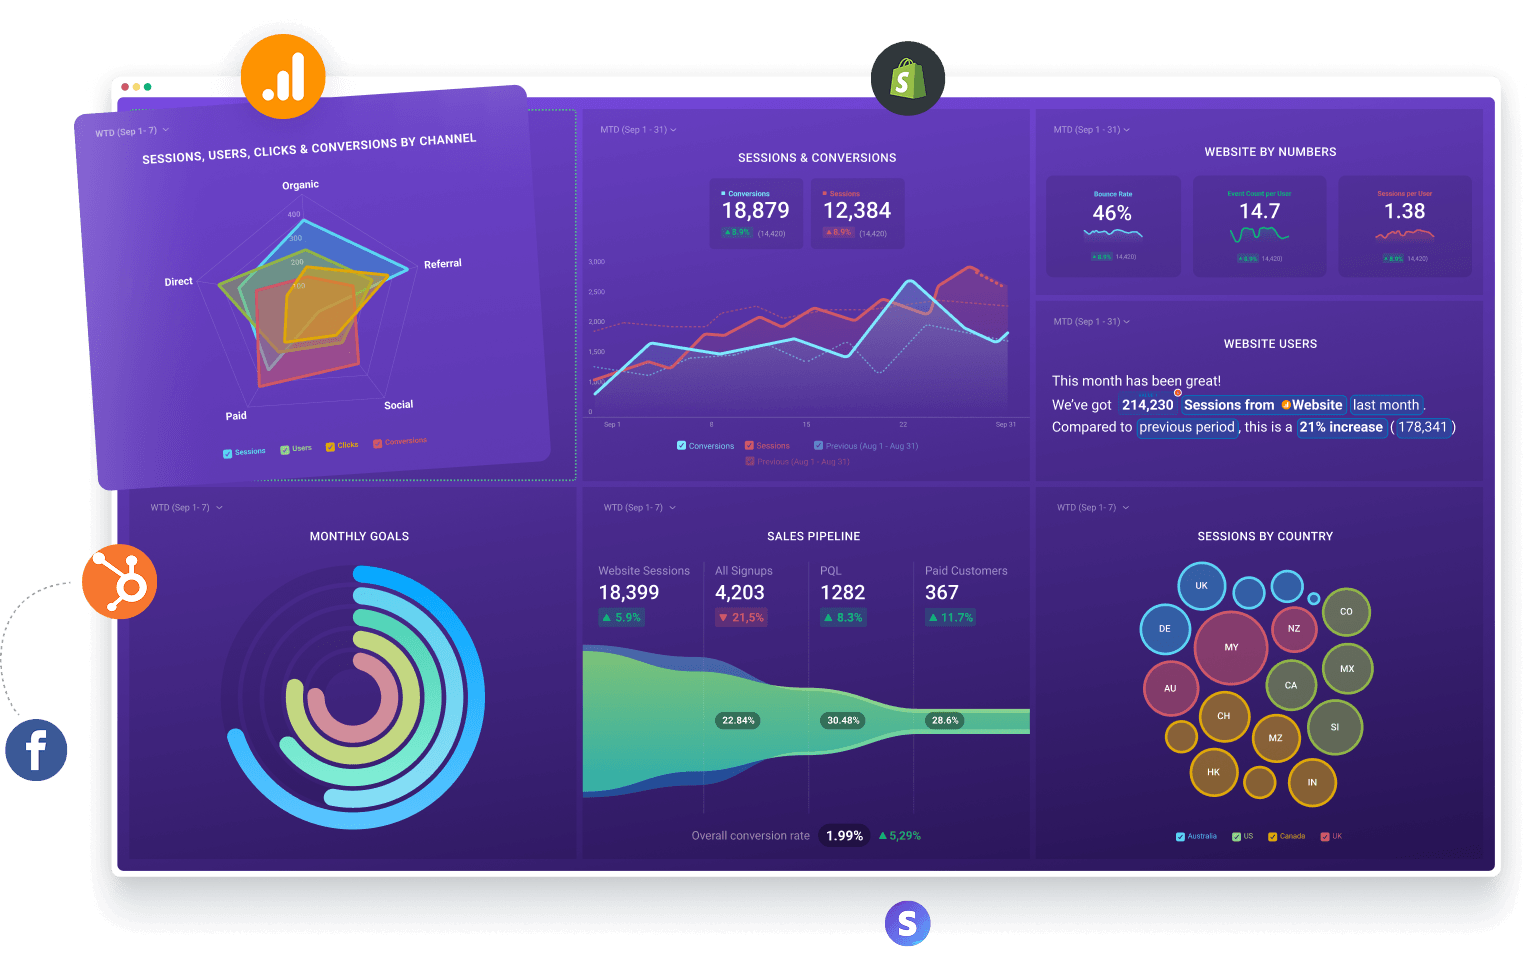
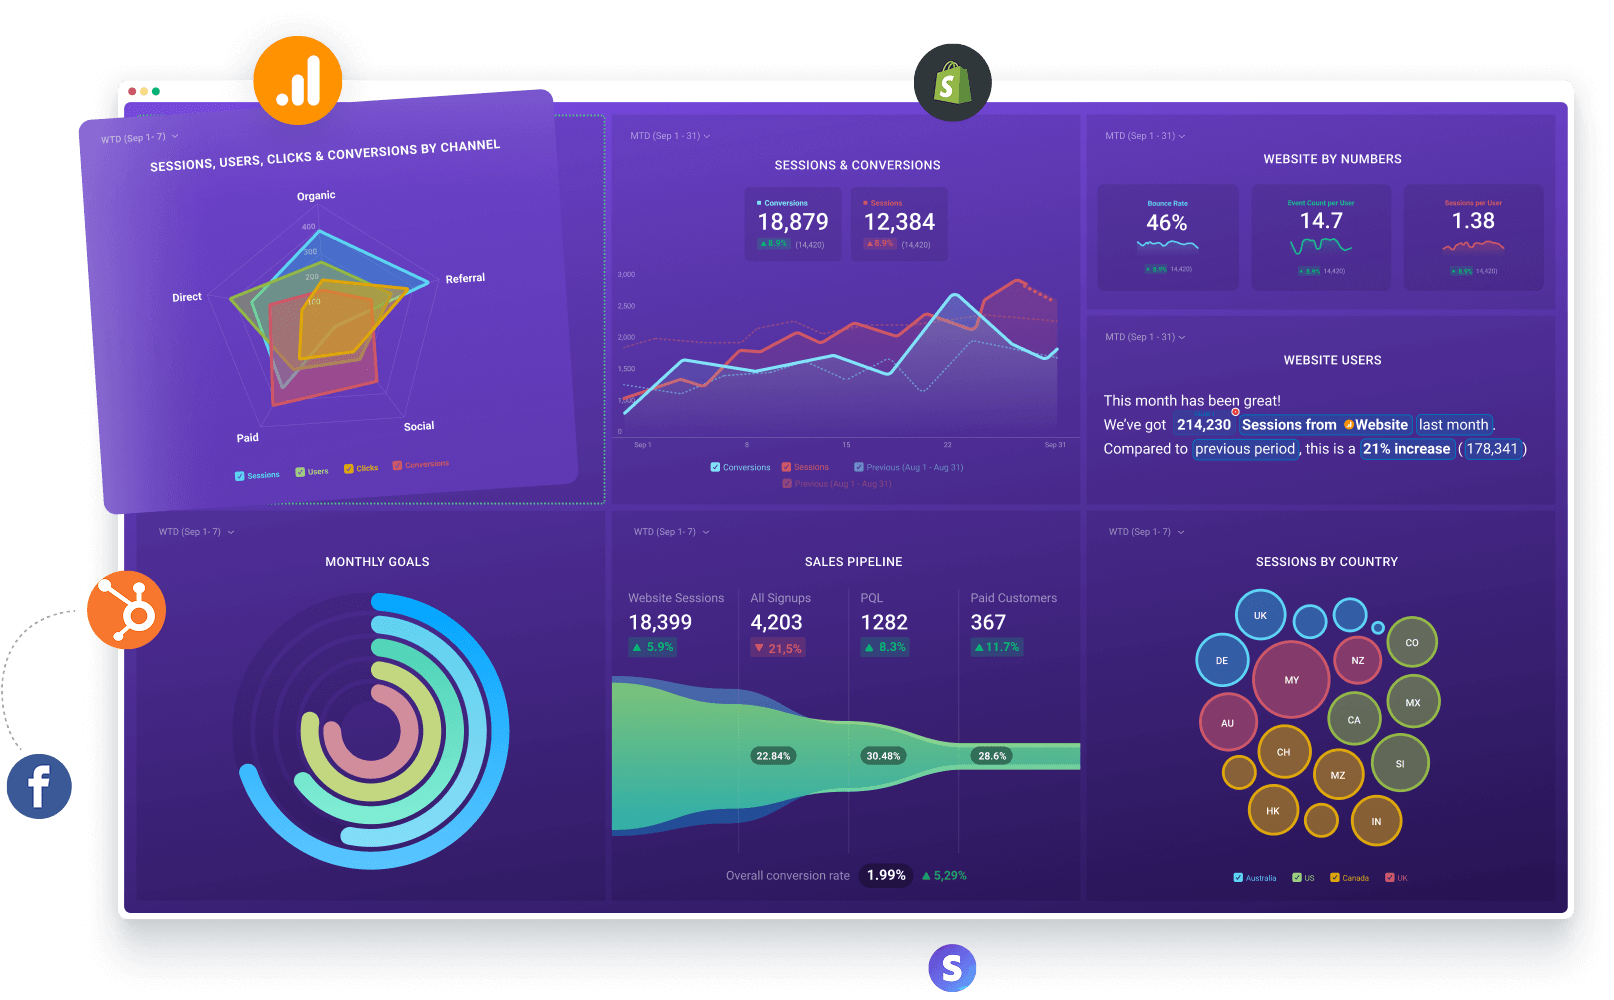
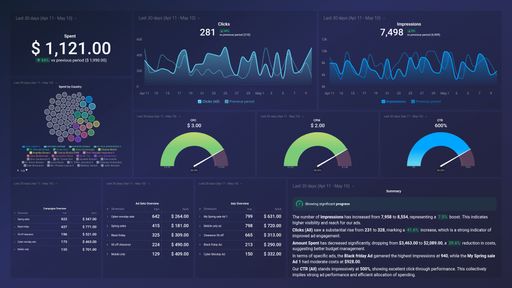
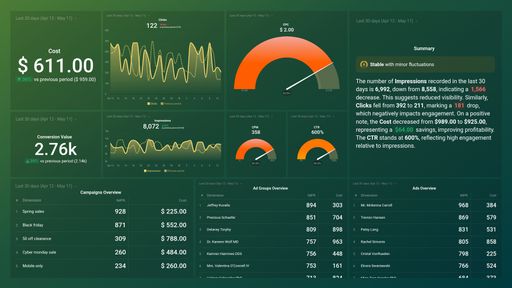
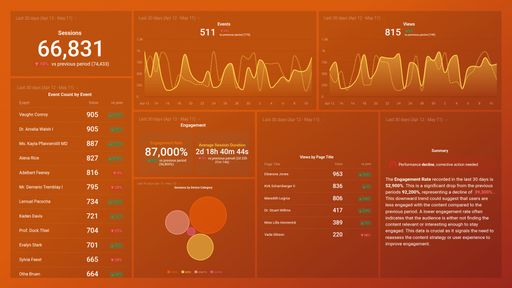
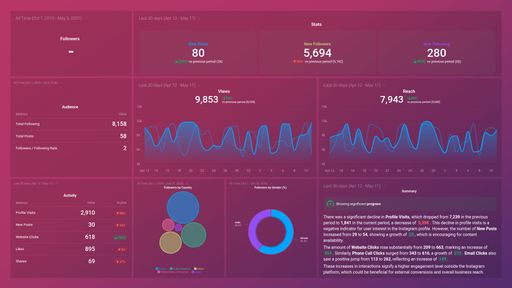
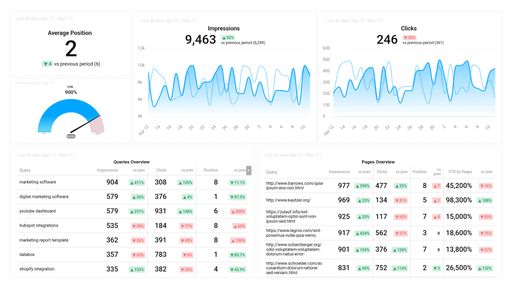
Dashboards
Visualize performance, monitor KPIs, and spot trends fast.
How it works
Pull your most important metrics into an interactive dashboard your team can explore and understand at a glance.
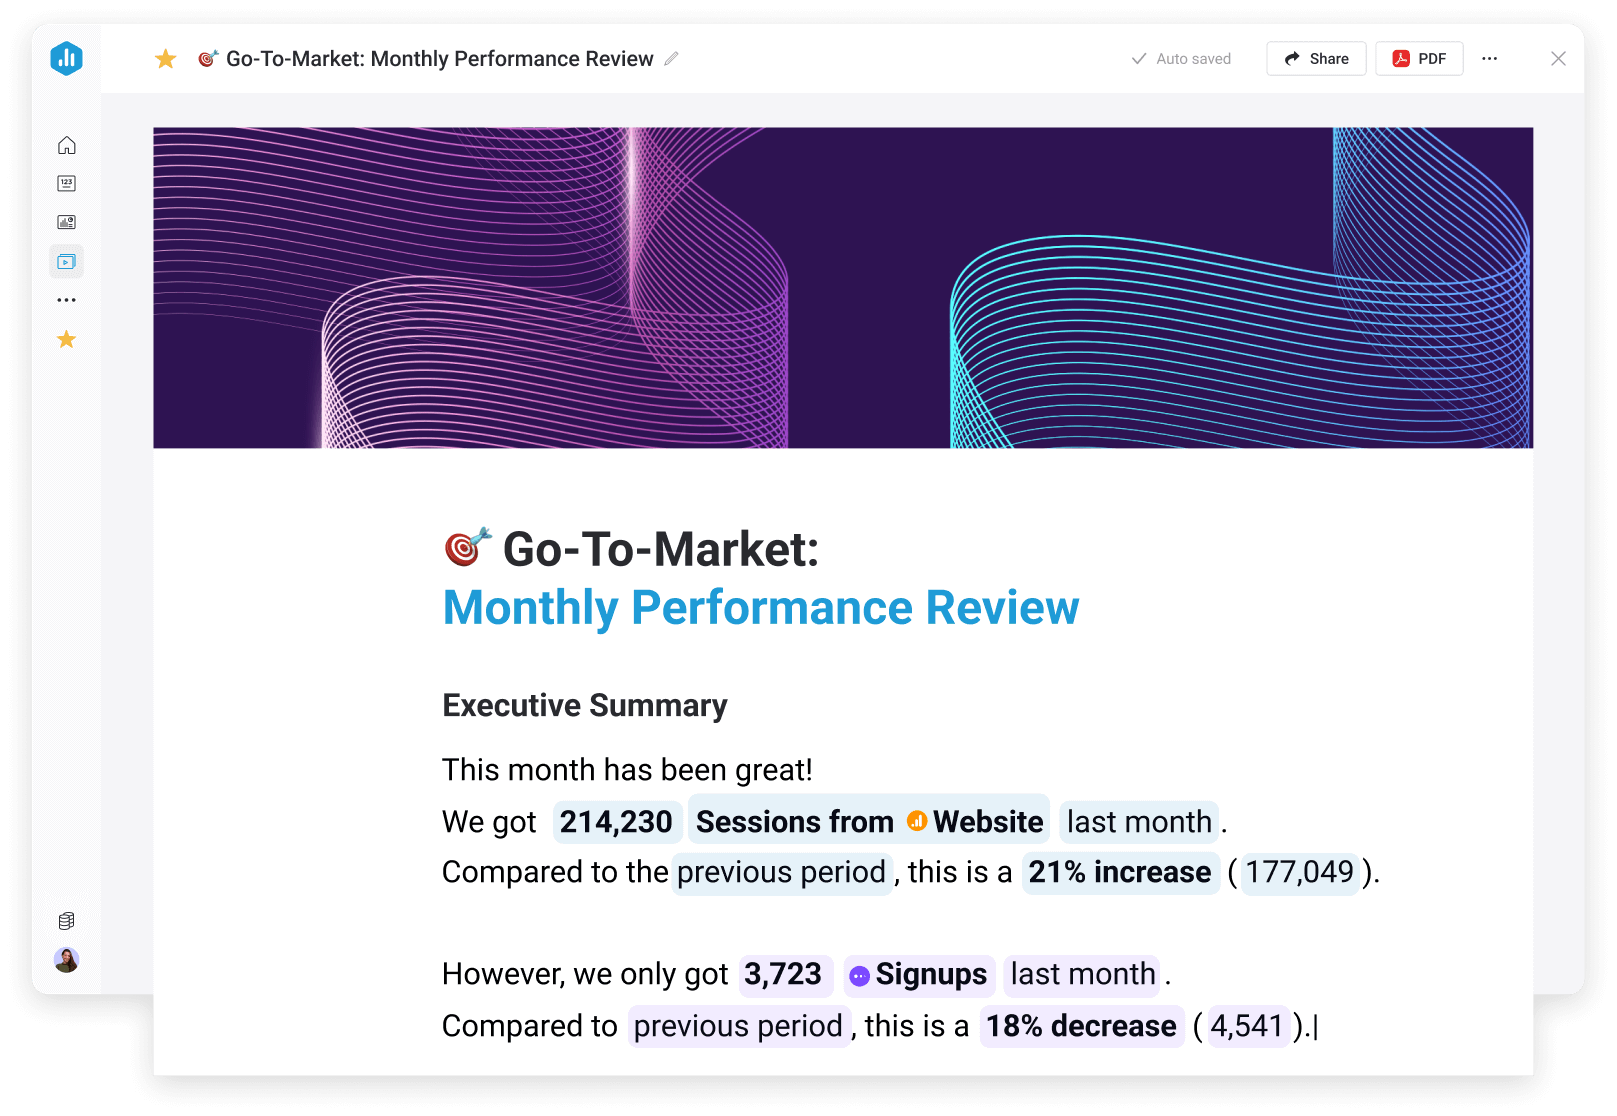
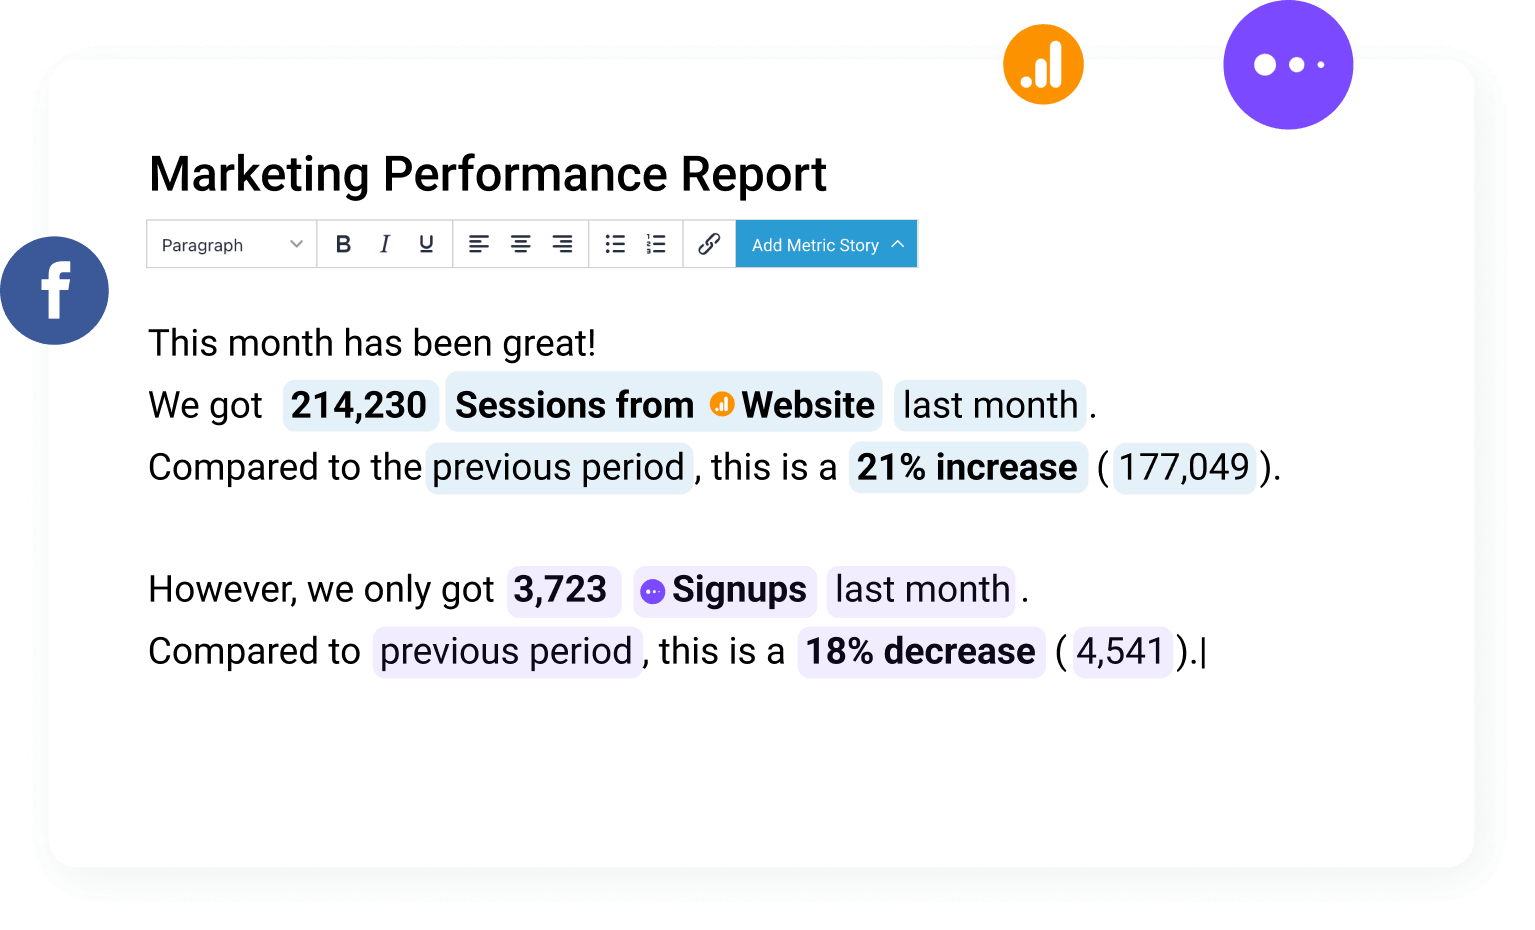
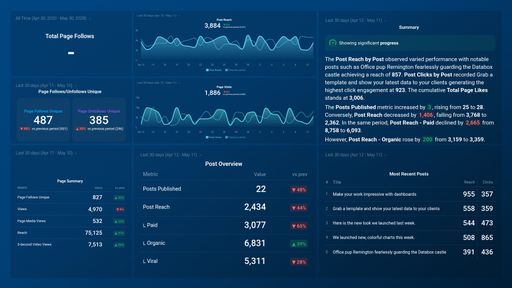
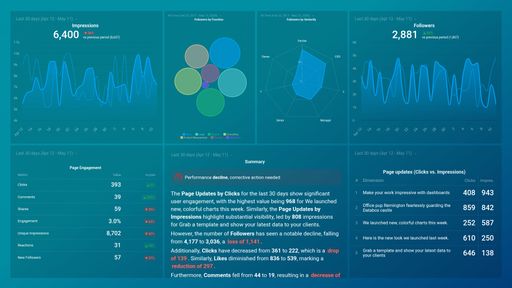
Reports
Automate reporting and clearly communicate performance.
How it works
Create scheduled reports that combine live metrics, visualizations, and written context so teams and stakeholders can quickly understand performance.
Turn scattered data into a
single source of trusted metrics
Dashboards, reporting, and AI analysis are only as useful as the data behind them. Databox helps you centralize your data and standardize your metrics, building a reliable foundation.
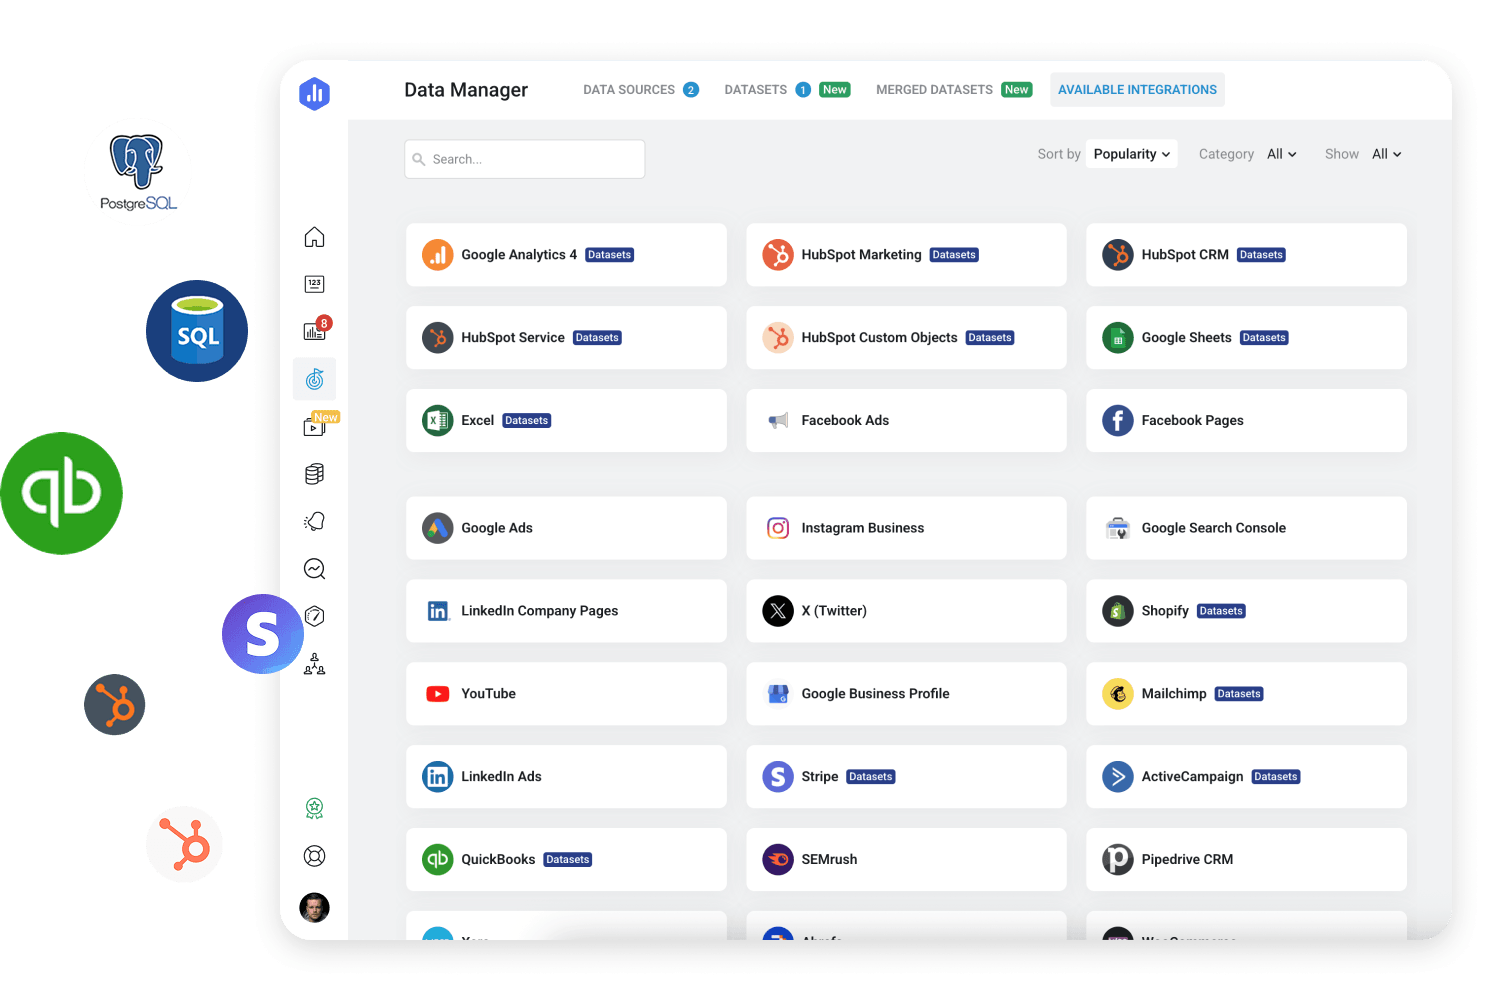
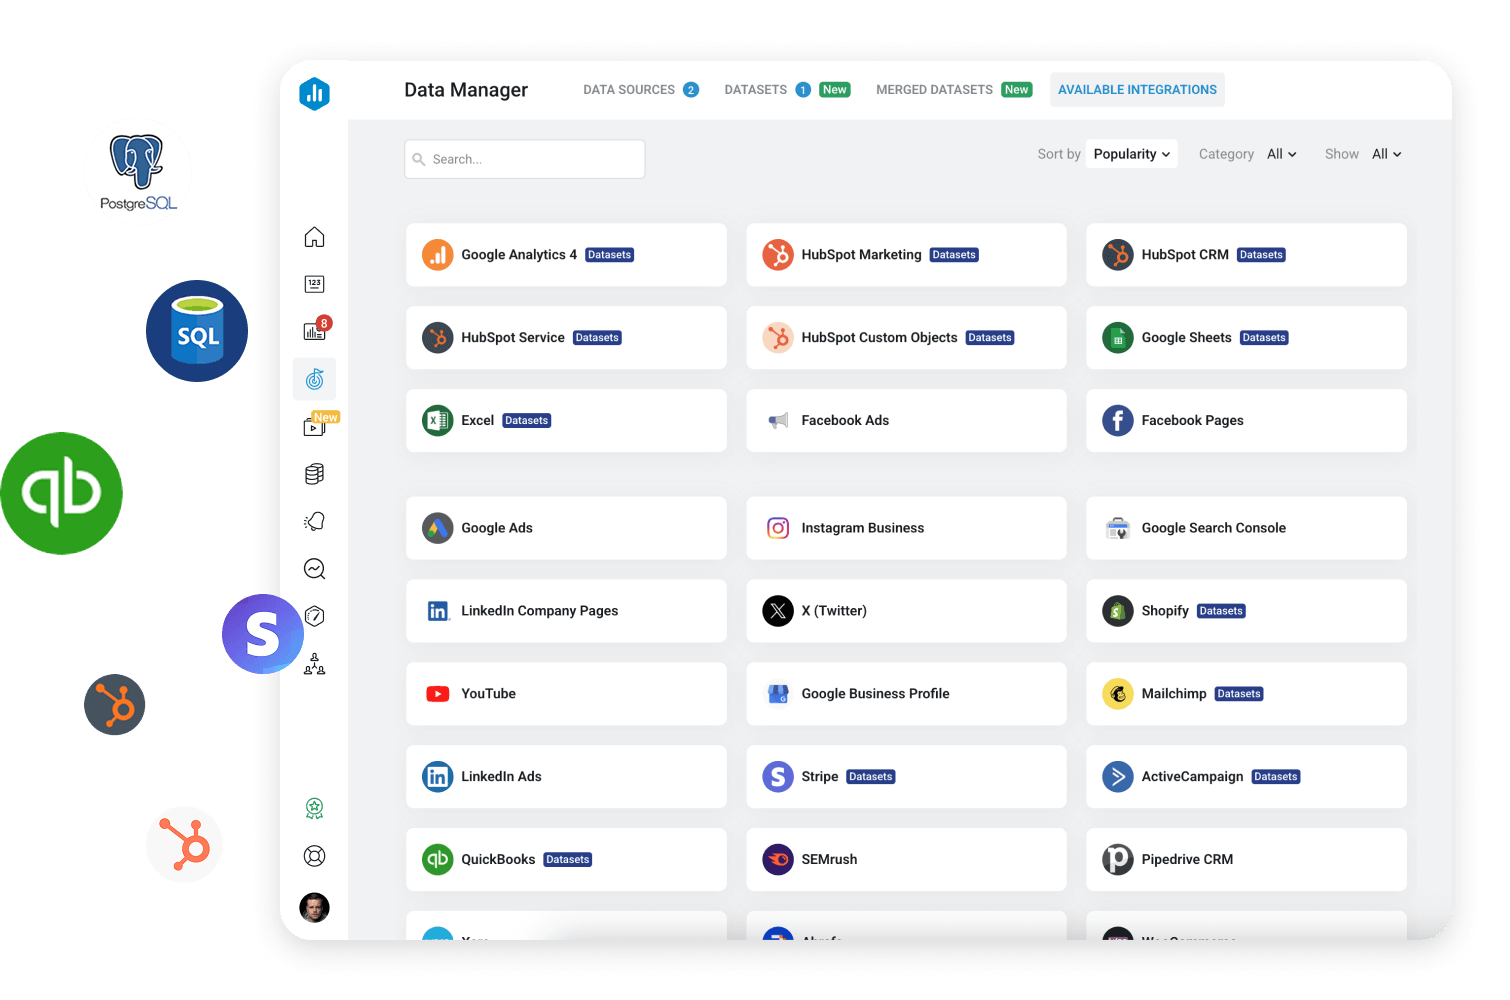
130+ Integrations
Connect data from your entire tech stack in minutes.
How it works
Pull data from your CRM, ad platforms, spreadsheets, databases, warehouses, APIs, and more, so your performance data lives in one place.
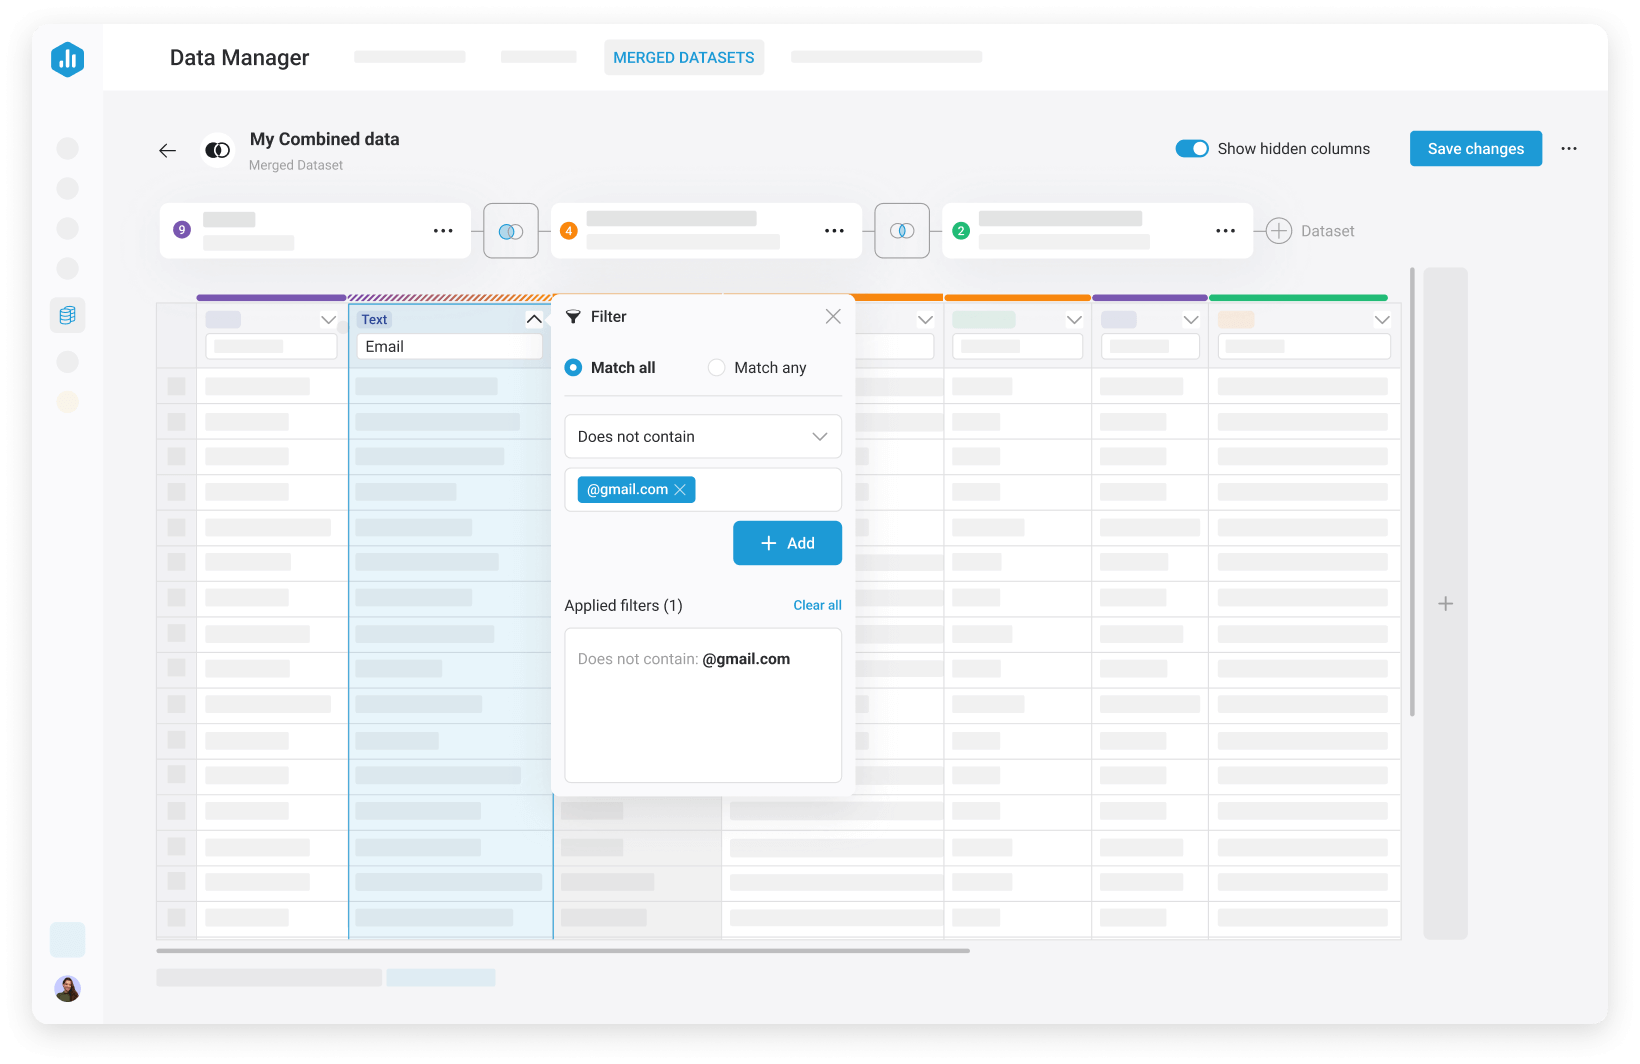
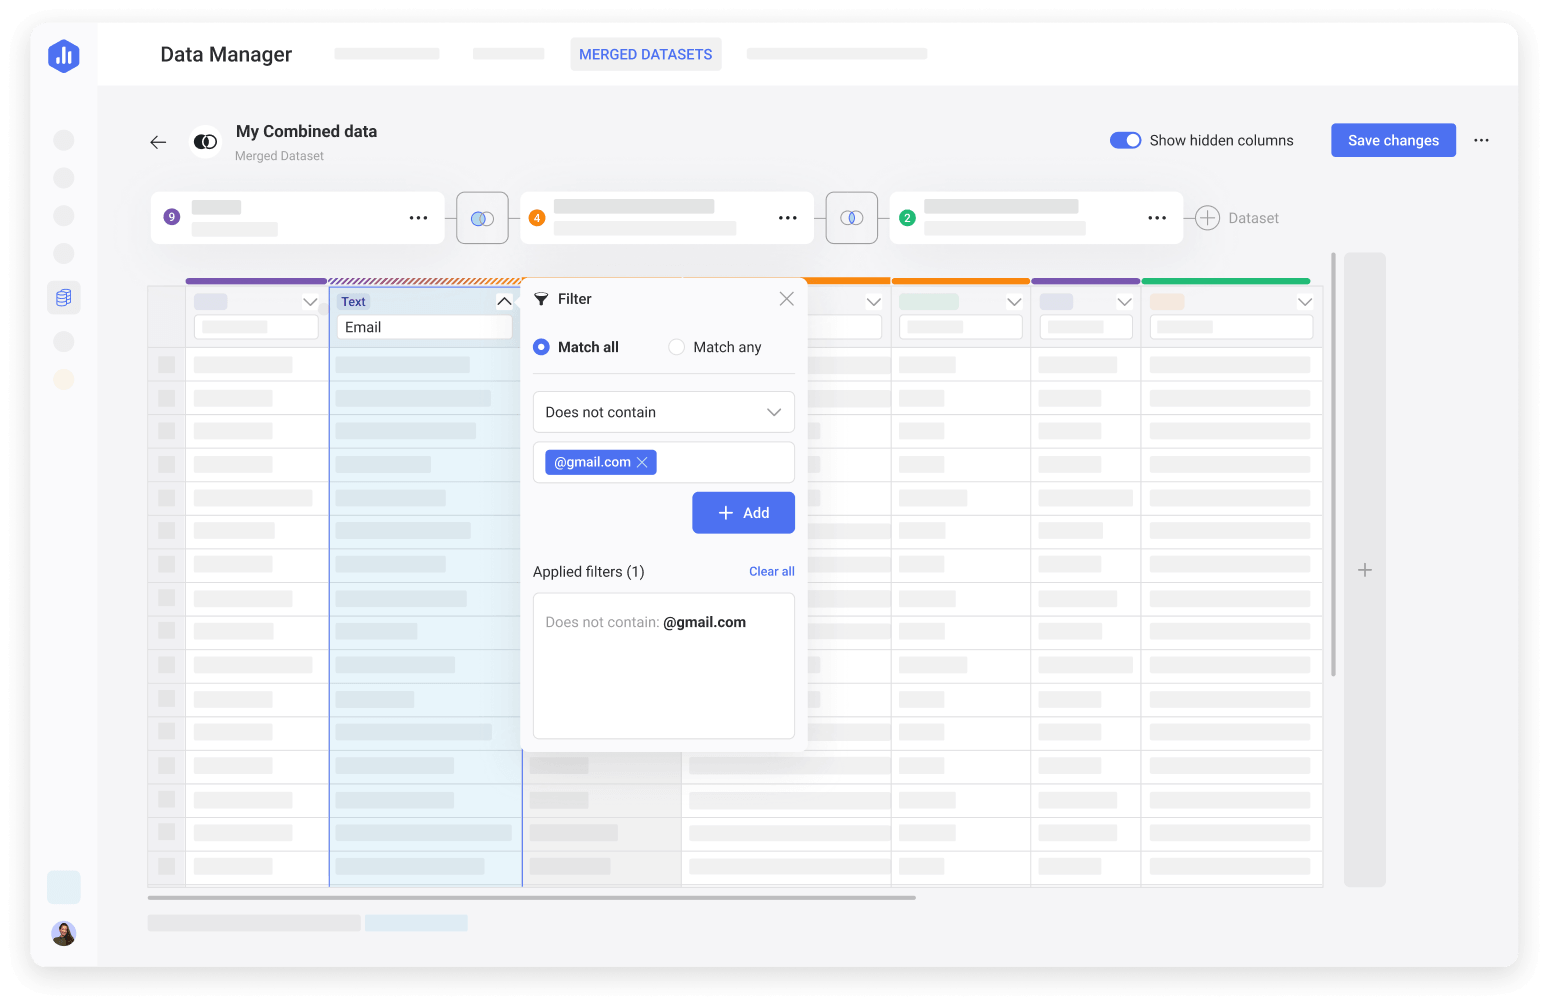
Datasets
Transform raw data into structured datasets your team can trust.
How it works
Filter, merge, calculate, and organize row-level data into curated datasets that power dashboards, reports, goals, and forecasts.
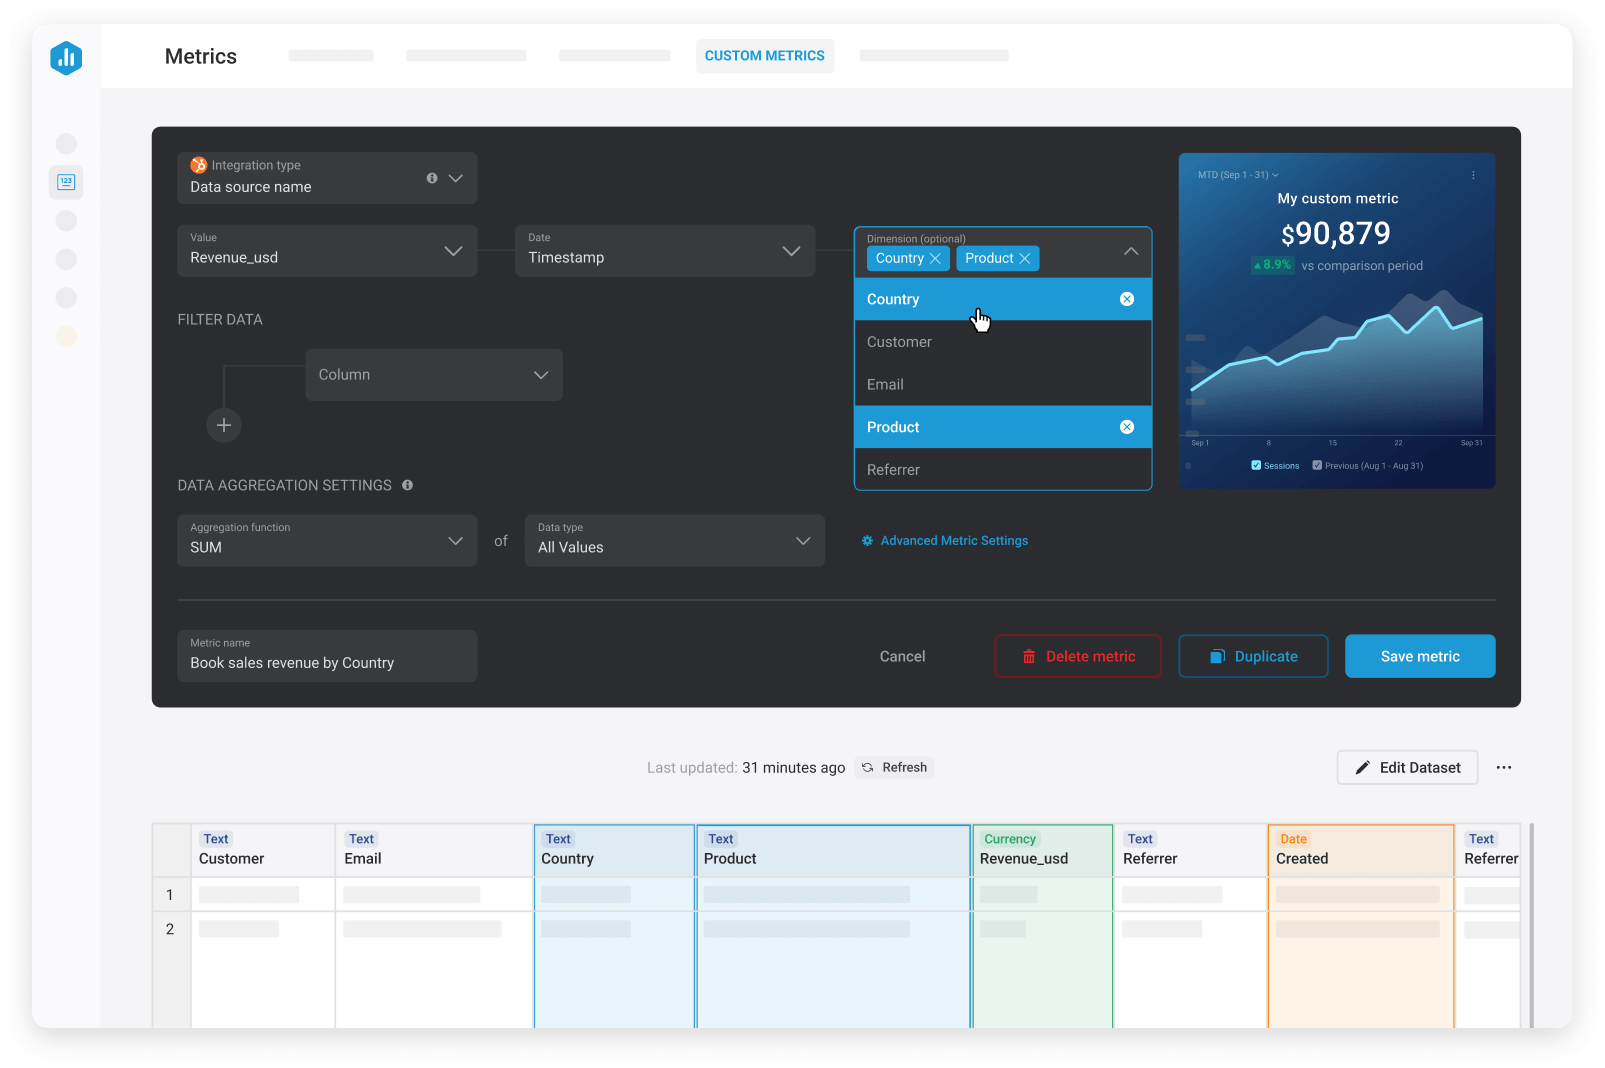
Metrics & KPI Builder
Standardize the KPIs and metrics that drive your business.
How it works
Choose pre-built metrics, create custom metrics with filters, dimensions and calculations, or build SQL-backed without heavy engineering support.
Manage business performance deliberately
Accelerate growth by connecting strategy, execution, and real performance data so teams understand results faster and adjust with confidence.

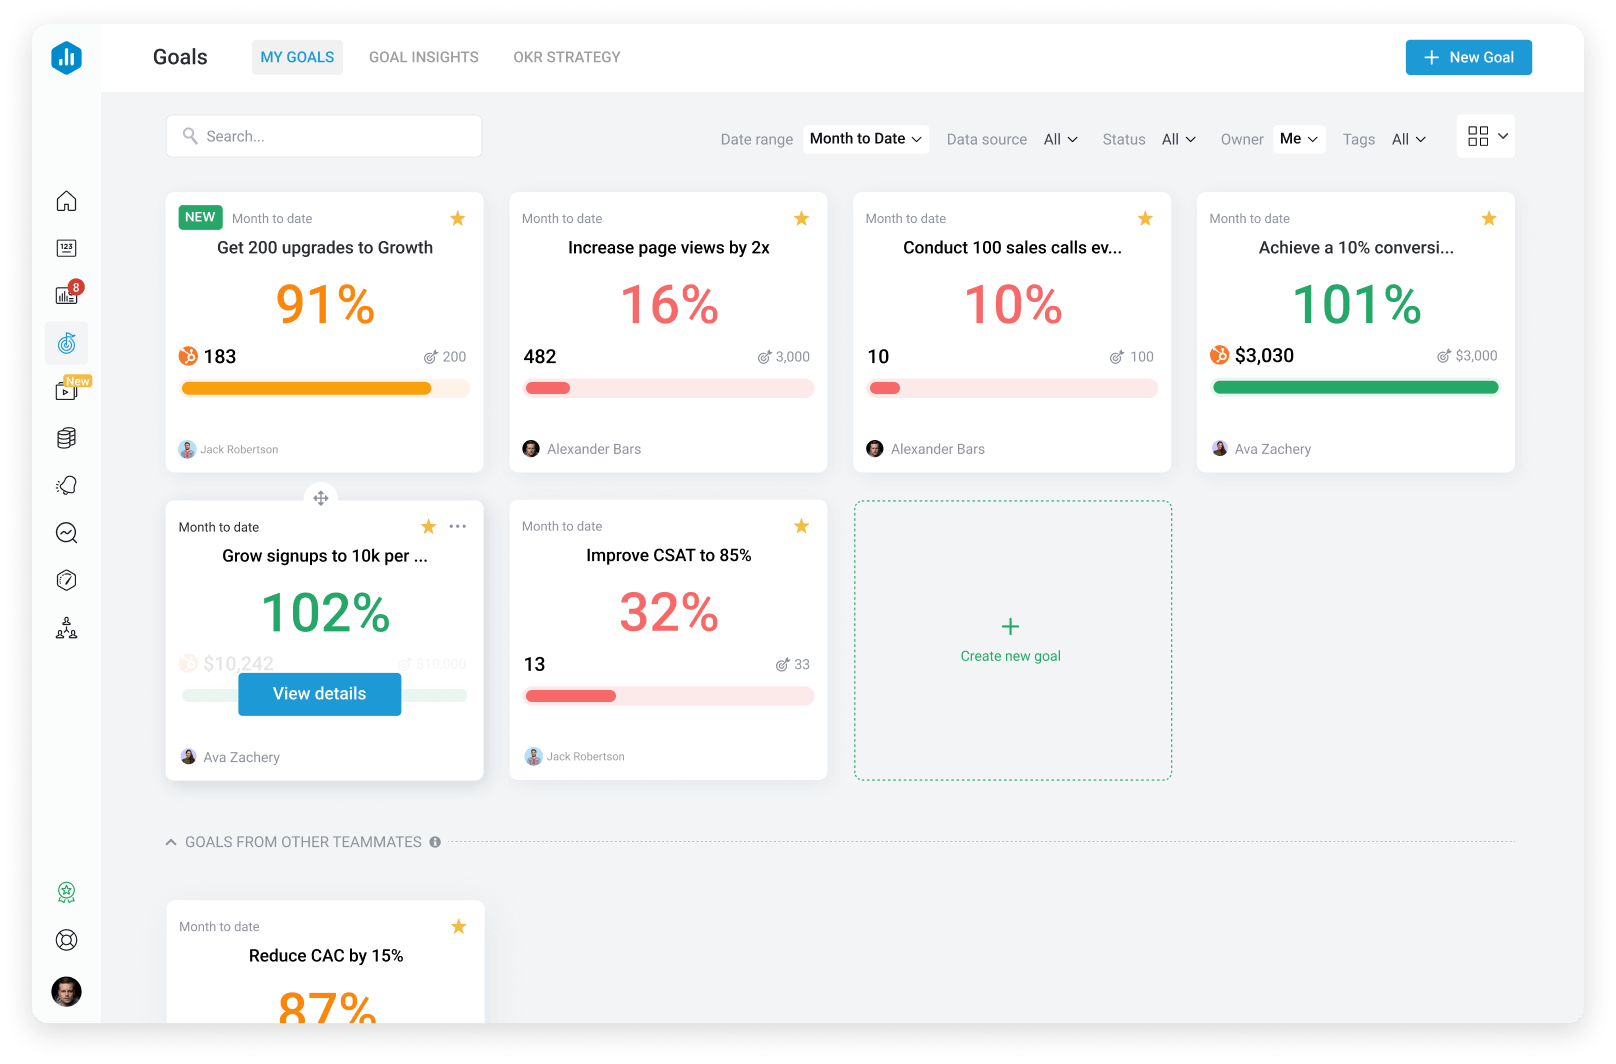
Goals & OKRs
Set measurable targets and keep your team aligned around the results that matter.
How it works
Set goals for any metric, define objectives to connect team initiatives to outcomes, and track progress in real time.
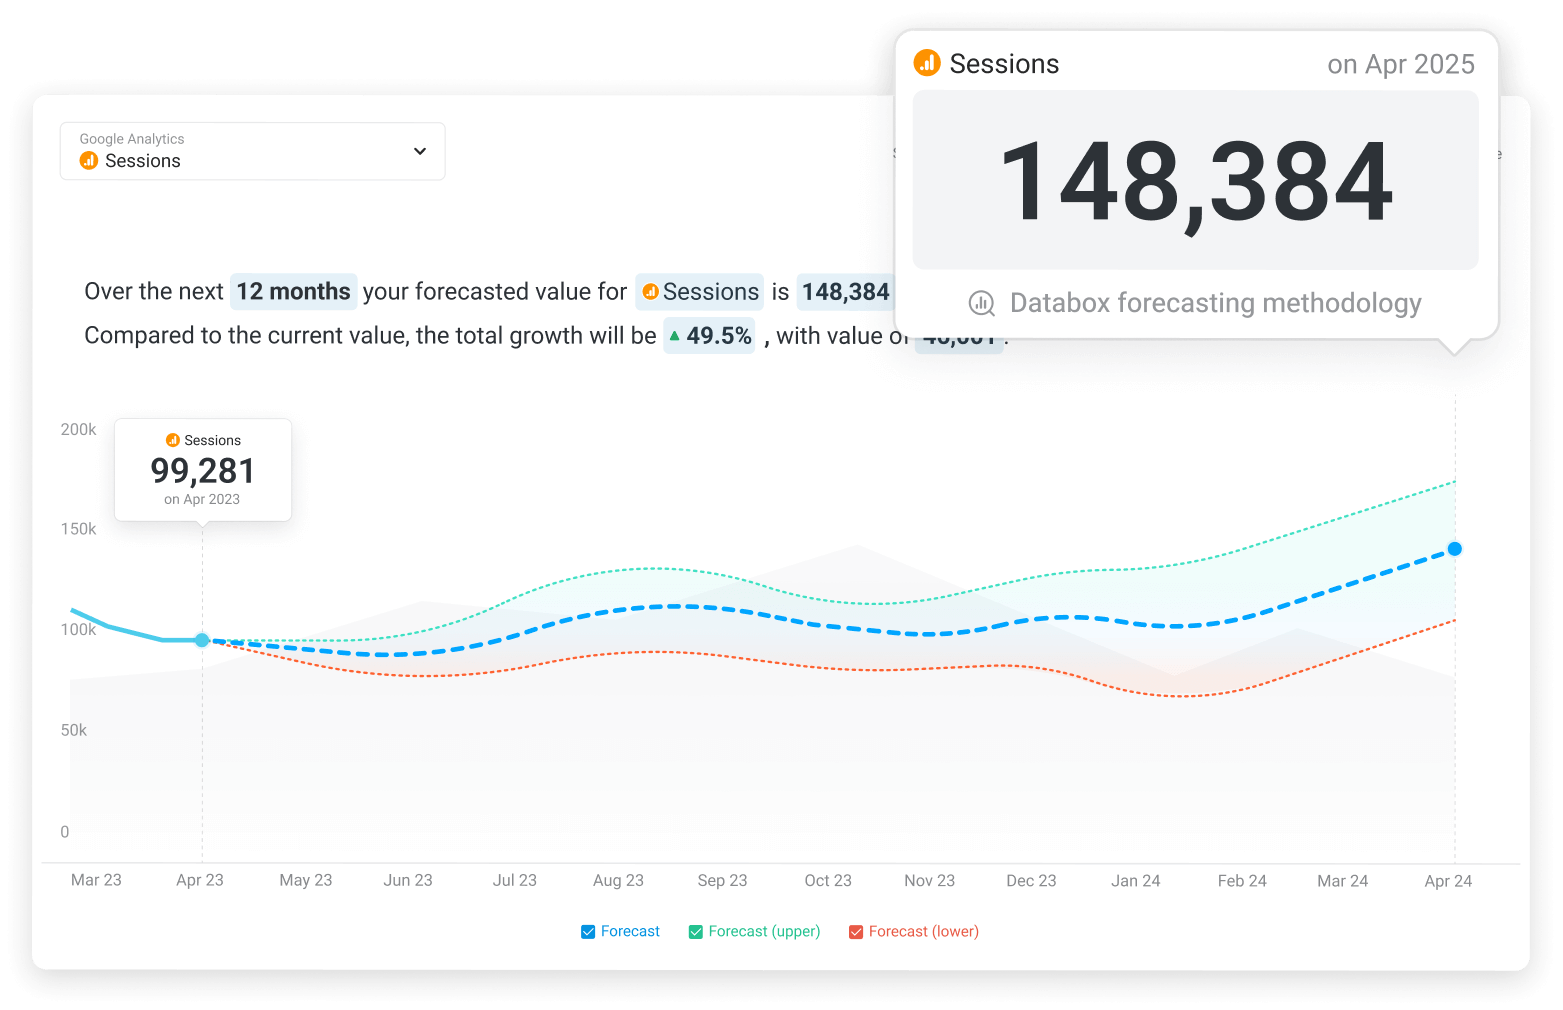
Forecasts
Plan ahead with data-driven projections.
How it works
Forecast any metric, model best- and worst-case scenarios, and understand the drivers behind future performance.
Predictable Scale
Connect strategy to repeatable execution.
How it works
Use the Predictable Scale framework to turn strategy into a practical plan, keep teams focused on the right metrics, and adjust based on performance data.
Choose from 300+ dashboard templates
Choose a template, connect your sources, and start getting answers from your data – fast.
Explore what others are building
in Databox
Discover practical use cases by role, integration, or feature.


Frequently Asked Questions
What is Databox?
Databox is a business intelligence and analytics platform, powered by AI, for teams that need clear, trusted answers fast.
Instead of digging through multiple dashboards, reports, or spreadsheets, teams can connect their tools, ask questions in plain English, and get instant explanations of what's happening in their business.
Databox pulls data from 130+ integrations and turns it into trusted metrics, visual context, and insights so teams can understand performance, explain changes, and decide what to do next.
What's new about Databox now that it's AI-powered analytics?
With AI-powered analytics, Databox lets anyone ask real business questions, get clear explanations, and move from dashboards to decisions – without waiting on analysts or rebuilding reports.
Whether your data lives in spreadsheets, reporting tools, databases, or across dozens of platforms, Databox connects directly to the tools teams already use — with native integrations, authentication management, and standardized metrics built in.
Instead of building pipelines, modeling every metric from scratch, or managing warehouses, teams can move straight from performance data to clarity, confidence, and action.
Do I still need dashboards and reporting if I use Databox AI?
Dashboards are still useful for monitoring metrics at a glance. Databox dashboards are easy to build and highly visual, making it easy to share business performance clearly and quickly.
But dashboards alone often raise more questions than they answer. Databox combines dashboards with AI explanations so teams can track KPIs, investigate changes, understand what's driving performance, and decide what to do next. In other words, dashboards show what happened, while Databox AI helps you explain why it happened.
How is Databox different from traditional BI tools?
Traditional BI tools are designed primarily for analysts who build data visualizations, like dashboards and reports. But they are often outdated and cumbersome, requiring a highly technical user who knows SQL and can manage complex data pipelines. But for many scaling businesses, this is overkill.
Databox helps teams who want to move fast get clear answers from their performance data, instantly. By removing the complicated setup, steep price, and long learning curve, Databox helps your data finally work at the speed of your business.
With self-service business intelligence and analytics, including 300+ plug-and-play templates, anyone on your team can build dashboards and reports in minutes.
And now with AI-powered analytics, anyone can ask questions in plain, conversational language and get explanations grounded in trusted metrics – without writing queries or even building dashboards.
Databox connects directly to your existing tools, so teams move from data to explanation to action without analytics bottlenecks.
Do I need a data warehouse or ETL tools to use Databox?
No. Databox connects directly to more than 130 business tools and platforms, so you can start analyzing performance without building complex data pipelines.
You can pull data from tools like CRMs, marketing platforms, spreadsheets, databases, and analytics tools into one place, then clean and standardize it using Databox datasets.
This allows teams to get answers from their data without engineering overhead.
Can I rely on Databox to keep my data accurate?
Databox standardizes metrics across your tools so AI answers are based on consistent business definitions — not raw, inconsistent data.
Not only that, but Databox's sync engine watches 130+ integrations around the clock. Over the last 90 days the public Status Page shows 100% connector uptime and 99.98% web-app uptime, and you can check those numbers any time. If an API changes, the connector flips to “Reconnect,” you get an instant in-app alert, and you can pull a manual refresh while support tackles the fix. In short, your dashboards stay fresh and you skip the connector headaches that plague other tools.
Can non-analysts use Databox?
Yes. Databox was built for self-service, so even a teammate who has never opened a SQL editor can explore data on their own. AI capabilities like Genie, the AI Analyst, allow anyone to ask questions of their data or build dashboards, simply by talking to their data.
Plus, with 300+ prebuilt dashboard and report templates, building data visualizations is easy and within reach for anyone, regardless of technical skill level.
The result is simple: business analysts focus on strategy instead of ticket queues, and every teammate owns the numbers they influence.
What tools does Databox integrate with?
Databox integrates with 130+ popular business and marketing tools. These include platforms for marketing analytics and automation, sales and CRM, finance and subscriptions, advertising, product analytics, and more.
Databox also lets you track any custom metrics from Google Sheets or Excel, run queries and pull structured data directly from your database or warehouse, or sync custom data from a Cloud-Based app with API access.
No matter where your data lives, Databox brings your data into one place so you can analyze performance across their entire tech stack.
How does Databox help teams manage performance?
Databox helps teams move from insights to action. In addition to analytics and dashboards, teams can align the organization around OKRs (objectives and key results), track goals and KPIs, forecast the performance of their metrics, set alerts for important changes, and share automated reports and updates.
This helps organizations connect strategy, execution, and real performance data so they can manage progress more deliberately.
Will Databox scale, or will we outgrow it as our business grows?
Databox is built to expand, not expire. Every paid tier already comes with unlimited users, unlimited dashboards, and unlimited custom metrics, so new teams or KPIs never force a plan jump.
When your stack gets heavier, Growth and Premium plans add data prep, row-level drill-downs, direct SQL database connectors, AI performance summaries while Premium even bundles 100 data sources before any overage kicks in.
All of it runs on the same cloud engine that has logged 100% connector uptime and 99.98% app uptime over the past 90 days. In short, you can start with one team and scale to the whole company without migrations, seat limits or performance trade-offs.
How secure and compliant is the data?
Databox runs on AWS infrastructure with AES‑256 encryption at rest, TLS in transit, VPC isolation, 24/7 monitoring, and quarterly penetration testing. The platform adheres to GDPR for all customers and inherits AWS's ISO 27001, SOC 1/2/3, and PCI‑DSS certifications. Role‑based access, audit logs, and data‑retention safeguards ensure only authorized users see sensitive information. Databox is currently pursuing SOC 2 attestation, expected in 2026.
What does Databox cost compared with legacy BI or building in‑house?
Legacy BI and in-house development can drain budgets; Databox keeps the numbers tight.
A typical enterprise-license BI stack charges per user and is billed annually, so rolling it out to just 25 people lands more than $30k a year before any consulting or setup fees. Hiring a single data engineer to build and maintain an in-house solution costs roughly $150k in salary alone, not counting tools or overhead.
By contrast, Databox offers a completely free plan for up to 3 users with access to 3 data sources, 1 dashboard, daily data refresh, and our brand new MCP, which lets you connect your data to your favorite LLMs like Claude and ChatGPT.
The Professional plan is $199 per month (or $159 per month with annual plan) and includes unlimited users, unlimited dashboards, and unlimited custom metrics – plus reports, goals, and the ability to pull data from Spreadsheets and Custom Integrations. Extra data sources are only $7 each per month (or $5.60 per month with annual plan).
The Growth plan (our most popular) brings in the power of Advanced Analytics, with the ability to do data preparation and build Datasets, plus raw data exports and drilldowns. It also unlocks AI-performance summaries, and anomaly detection.
And if you need more horsepower? Premium is $999 per month (or $799 per month with annual plan) with 100 data sources bundled and still no per-seat fees. It packs in a lot of additional value, including OKRs, advanced security, 15-minute sync, priority support, and more (add-ons valued at over $1100).
Every plan starts with a 14-day full-feature trial so you can prove ROI before spending a dollar.
Because dashboards can go live the same day and there's zero per-user licensing, most teams recoup the subscription in days instead of quarters. Leaving six-figure legacy costs (and salaries) on someone else's balance sheet.

Make better decisions,
together, faster
Compare
Databox Inc.
HQ: Boston, MA, USA
AI-powered analytics for teams that need answers now.
Databox Inc.
HQ: Boston, MA, USA

AI-powered analytics for teams that need answers now.


Compare