How to Track Paid Advertising Performance with HubSpot & Databox
Align paid ad platform data with business outcomes.
Devin Littlefield of Market Vantage walks through how his team uses Databox + HubSpot to evaluate campaign performance for their clients. With a custom scorecard that blends data from Google Ads, LinkedIn Ads, HubSpot Marketing, and HubSpot CRM, they track key outcomes like MQLs, SQLs, booked meetings, and deals to optimize spend and prove impact.
Try it yourself
Check out our step-by-step tutorial to try building this dashboard for yourself or simply reach out to our team to get personalized help setting up your own dashboard.
See the full dashboard in action.
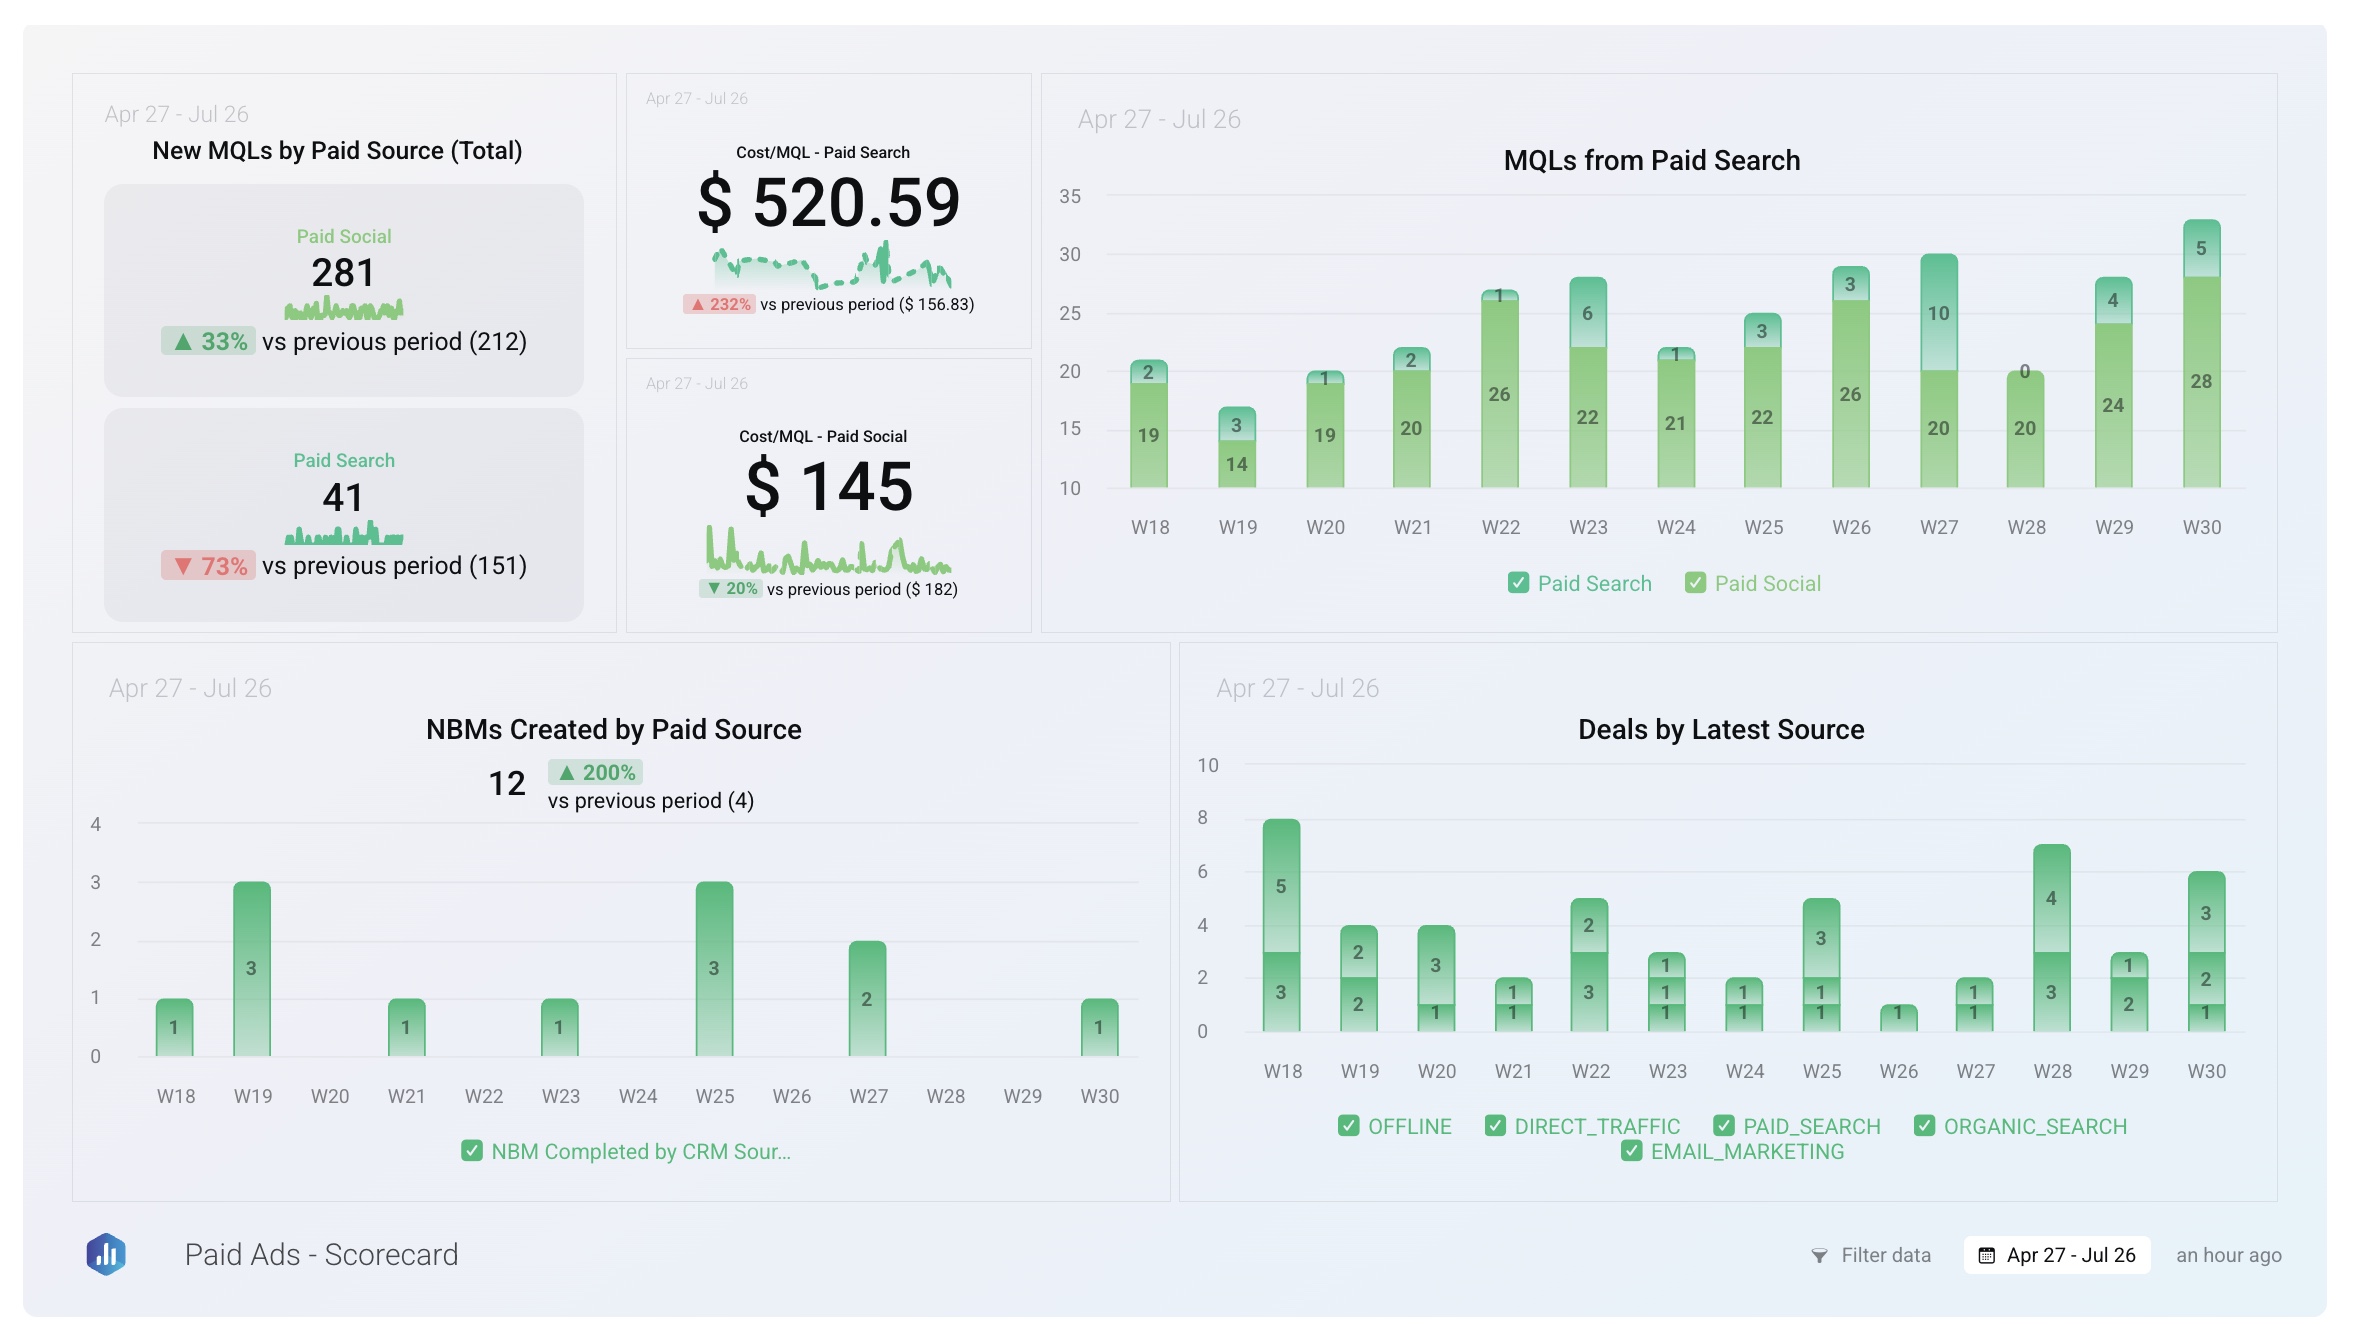
Explore the full scorecard Market Vantage uses to analyze advertising performance over time.
This dashboard blends Google Ads, LinkedIn Ads, HubSpot Marketing, and HubSpot CRM data, with calculated metrics and custom objects that reflect how real leads move through the funnel.
Explore more resources
Browse related templates, tutorials, and expert articles to help you improve your paid ad reporting and run paid ad campaigns with impact.
- [Templates] Must-Have Paid Ads Dashboards
- [Video] Paid vs Organic Marketing: What Works in 2025?
- [Article] The 28 Advertising KPIs That Every Marketing Expert Should Track
Need more help with your advertising and marketing strategy?
This dashboard was created by MarketVantage, a digital marketing agency specializing in helping B2B businesses grow through data-driven strategies. They offer a range of services including strategic consulting, marketing automation, conversion rate optimization, and advertising management on platforms like Google, Bing, LinkedIn, and Facebook. MarketVantage is a Databox Solutions Partner and licensed reseller.

Tutorial: How to build this dashboard with Databox
When you blend ad data with HubSpot outcomes, you go from guessing to knowing. This scorecard gives you and your team clarity on what’s working, where to optimize, and how to communicate results that matter.
What the scorecard solves for:
- Measuring cost per MQL and SQL across channels
- Visualizing trends with a 12-week performance scorecard
- Segmenting MQLs and meetings by source and campaign
- Aligning marketing and sales on real business outcomes
- Making optimization decisions with confidence
What the scorecard shows:
- New MQLs by Paid Source
- Cost/MQL by Paid Source
- New Booked Meetings (NBM) by Paid Source
- Deals by Latest Source
How to calculate cost per lead for paid search
The key to this paid ad attribution scorecard is calculating cost per lead for paid search using different lifecycle stages. Cost per Lead (CPL) is a key metric for evaluating how efficiently you’re generating leads across your paid channels.
In Databox, you can calculate CPL by combining your ad platform spend with Lifecycle stage metrics from your CRM, broken down by Source. This setup helps you analyze CPL not only for leads, but also across stages like MQL, SQL, or Customer, and filter by specific attribution sources like Paid Search.
Create custom metrics for Lifecycle Stages by Source
Use your CRM (e.g., HubSpot) to build metrics like:
- Leads by Source
- MQLs by Source
- SQLs by Source
- Customers by Source
Create a Data Calculation to get CPL for Paid Search
Use Data Calculations to combine metrics:
- Add Cost from all relevant ad platforms (e.g., Google Ads + Facebook Ads + Twitter Ads).
- Divide by Leads by Source.
- Set the breakdown to Source and filter it to Paid Search.
Repeat the calculation for other Lifecycle stages
You can replicate the same calculation logic for Cost per MQL, Cost per SQL, or Cost per Customer.
PRO TIP: Filter leads by page that converted them
For deeper insights, filter your Lifecycle stage metrics by a field like Original Page or Latest Drilldown Source to isolate specific campaigns or landing pages.
For example, if you’re filtering for Google Ads only, use Cost from Google Ads and Leads attributed to Google Ads in your calculation.
This avoids inflating CPL by including spend from channels that didn’t contribute.
Want help building your own version?
Contact our team – we’ll build it for free.
FAQ
Can I build custom metrics like cost per MQL, cost per SQL, total ad spend, deal volume, or blended ad spend in Databox?
Yes. Databox’s Metric Builder for HubSpot lets you combine any available metric(s), dimension(s) and filters to calculate figures such as Cost‑per‑MQL, Cost‑per‑SQL or blended spend across ad networks. Metric Builder is included on Professional plans and above.
Can Databox combine Google Ads and LinkedIn Ads spend into one “Total Ad Spend” metric?
Yes – use Data Calculations to add Cost from each connected ad source. The same feature can divide that total by leads, MQLs, or SQLs to create blended CPL or Cost-per-MQL metrics. Learn more.
Can I filter a Databox dashboard by campaign, ad, or country?
Yes. In the Designer, open the Settings & Controls ▸ Filters panel and choose “Campaign,” “Country,” “Ad,” or any available dimension to make your Databoard interactive.
Make better decisions,
together, faster
Product
Compare
Databox Inc.
HQ: Boston, MA, USA
Modern BI for teams that needs answers now
Databox Inc.
HQ: Boston, MA, USA

Modern BI for teams that needs answers now


Product
Compare