Databox vs. Looker Studio
Make your data beautifully simple
Modern teams don’t have time for reporting that creates more work. Databox makes insights fast to find, easy to share, and simple enough for anyone to use confidently.
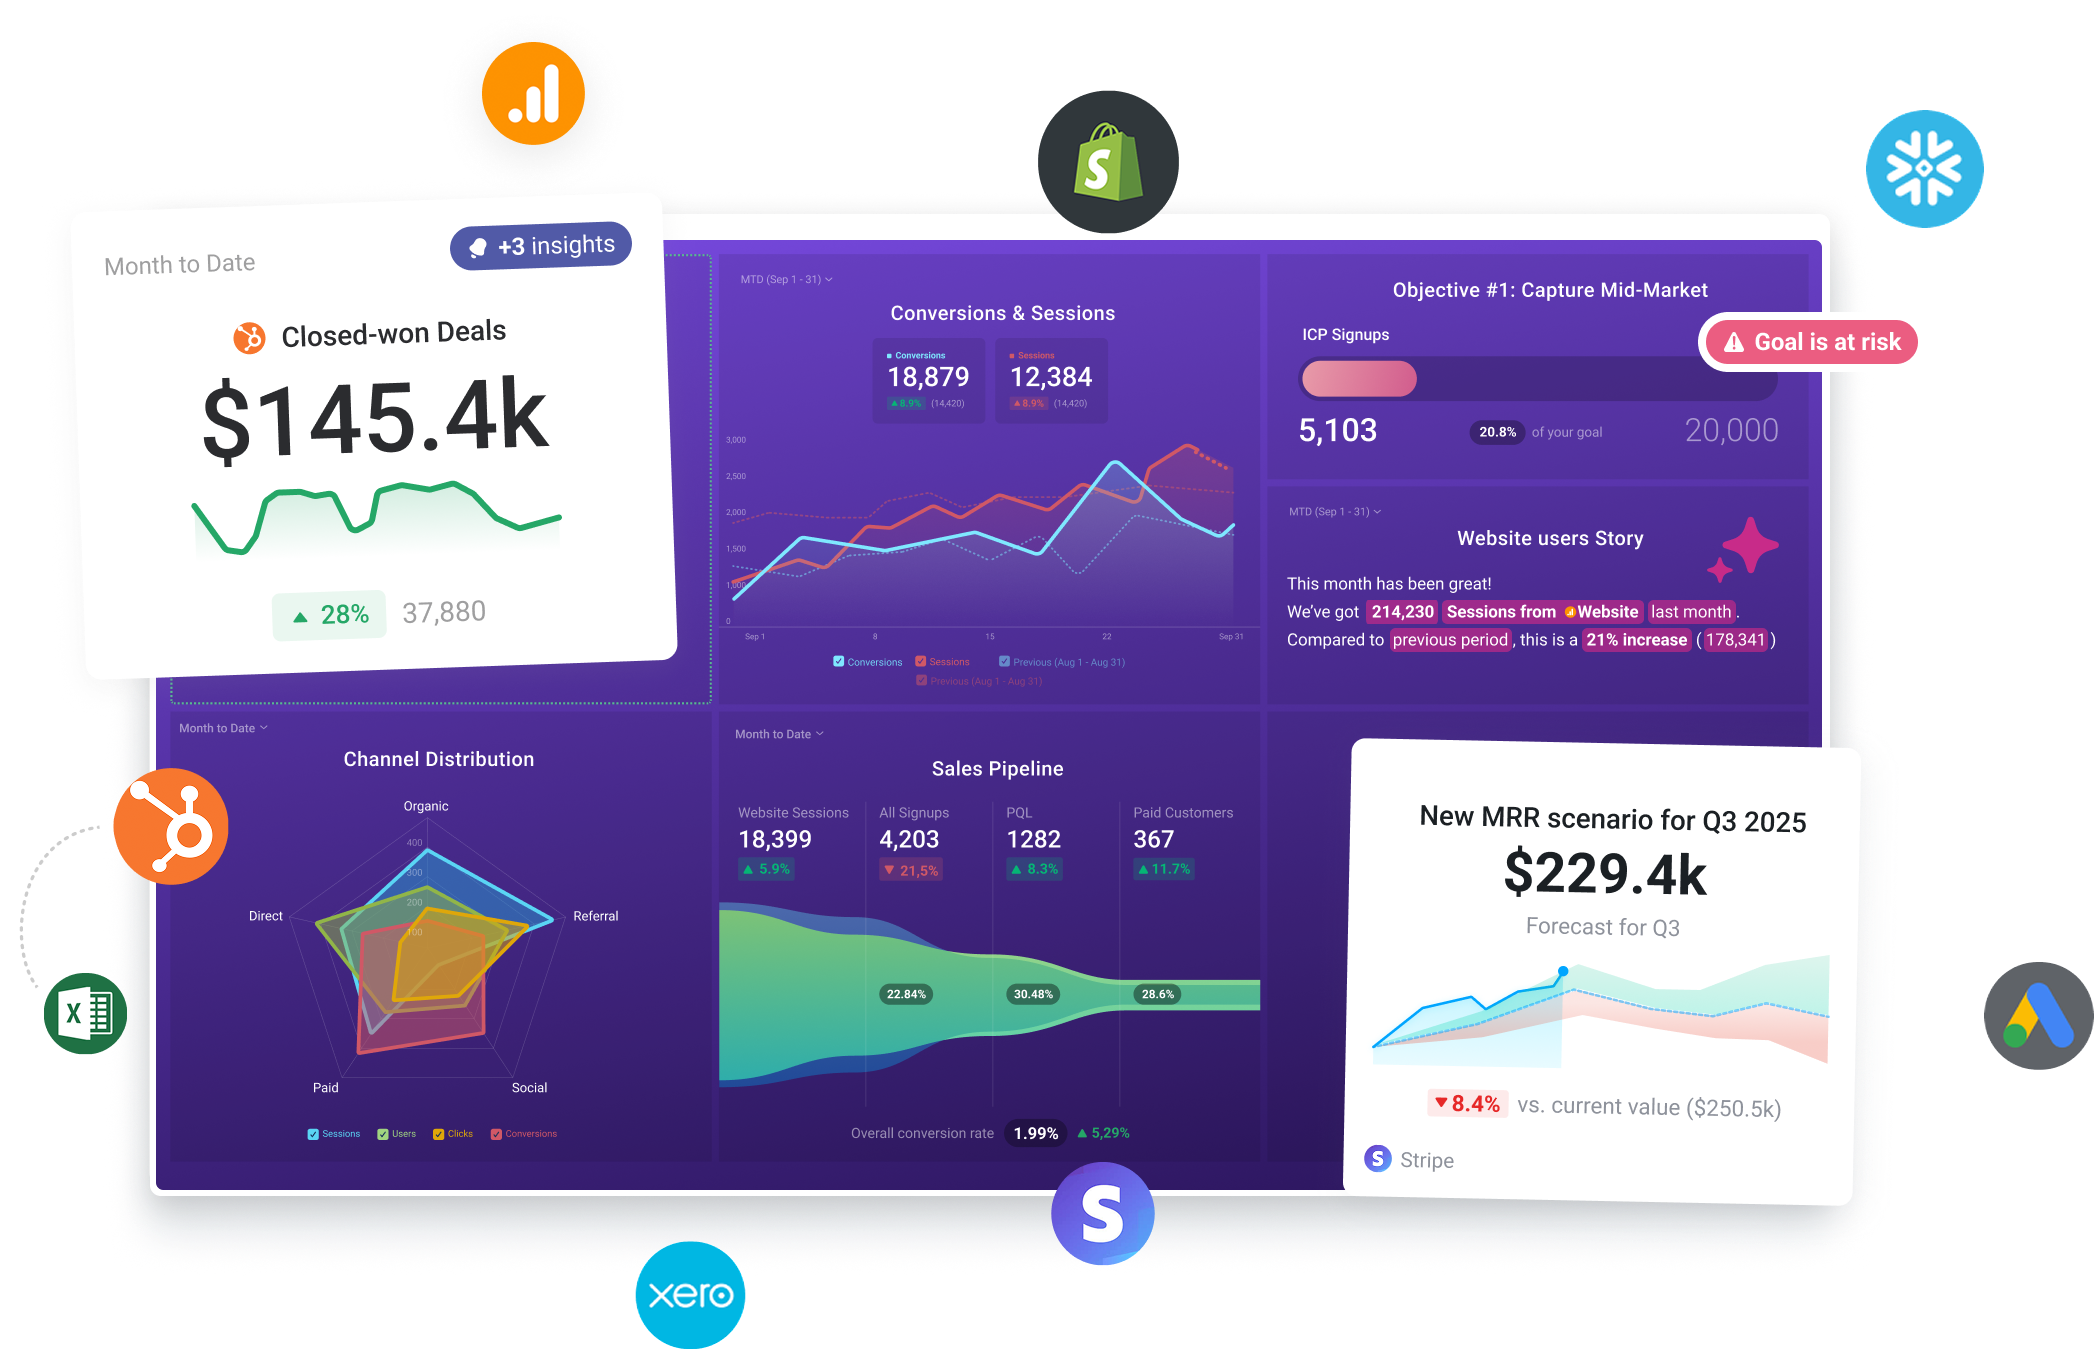
We put the same exact data in Databox that we put in Looker Studio. Clients were confused with Looker, but with Databox, they were engaged, excited, and even shared it with more people in the company. It’s not just about the data – it’s the visuals.
See why teams are choosing Databox
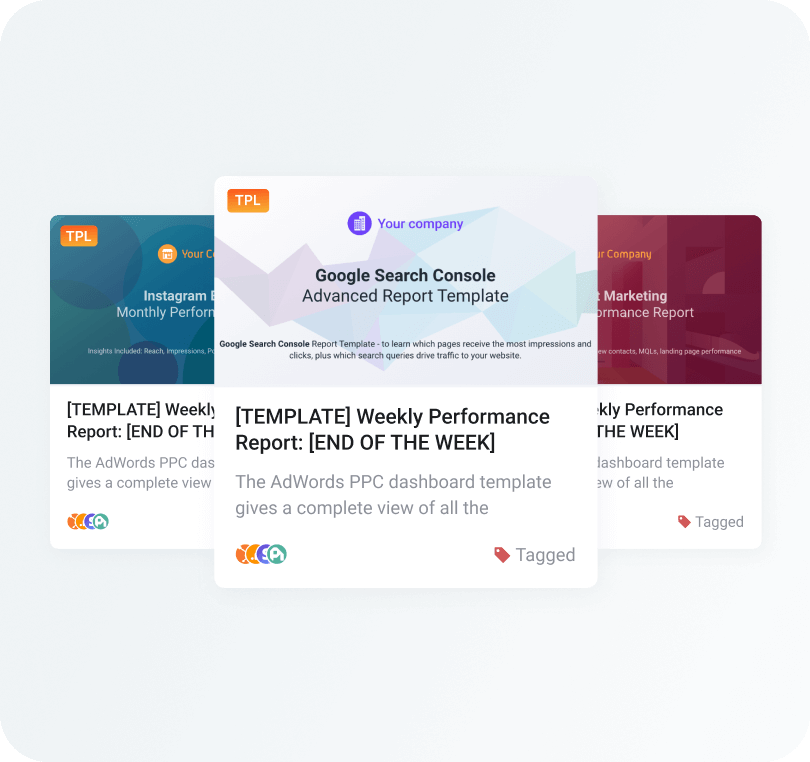
Self-serve analytics anyone can use
Databox removes the need for technical skills or complex setup. With no-code builders, 130+ integrations, pre-built templates, and unlimited users, anyone on your team can explore data, build dashboards, and uncover insights on their own
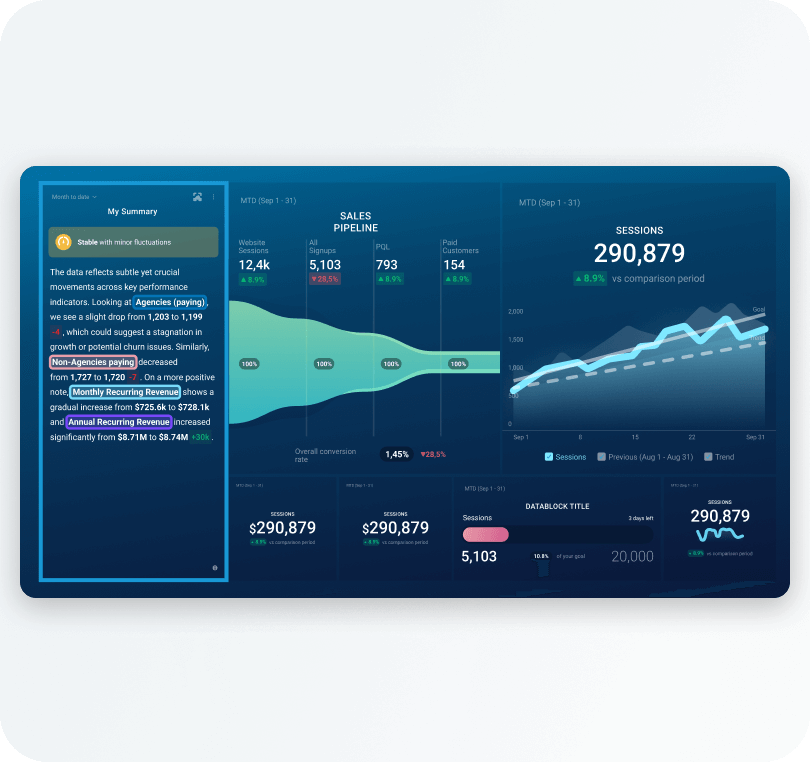
Reporting designed to be understood
Cut through clutter with dashboards that make performance instantly clear. Databox combines clean, modern visuals and flexible layouts to highlight what matters most, helping teams and clients spot trends, uncover insights, and take action faster.
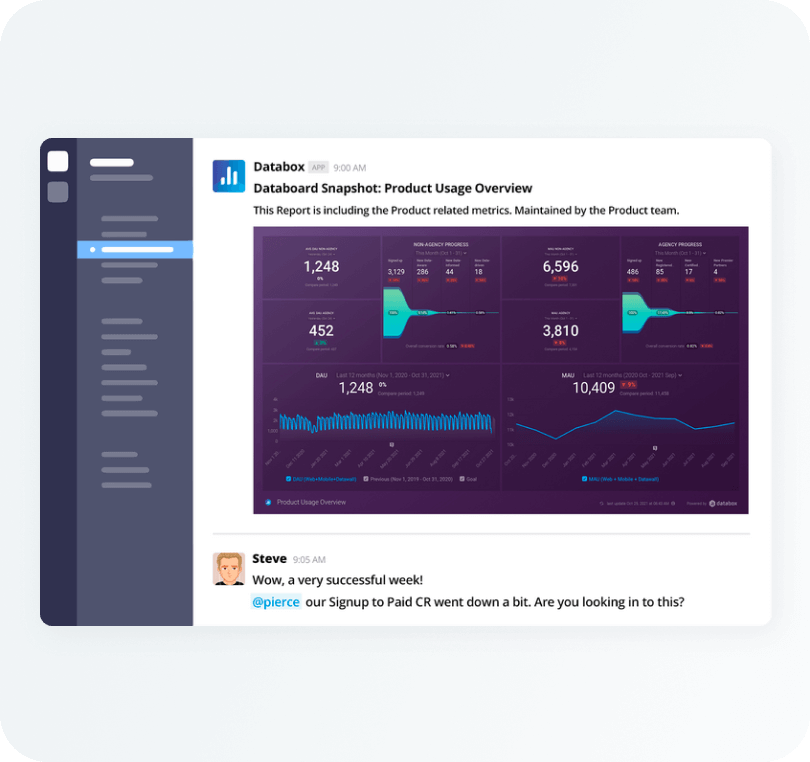
Insights that reach the right people automatically
With live links, email and Slack updates, TV streams, embeds, and more, Databox makes it easy to deliver real-time insights to teams and clients (inside and outside your organization) without the headache.
Before you decide, here are the answers you’re looking for
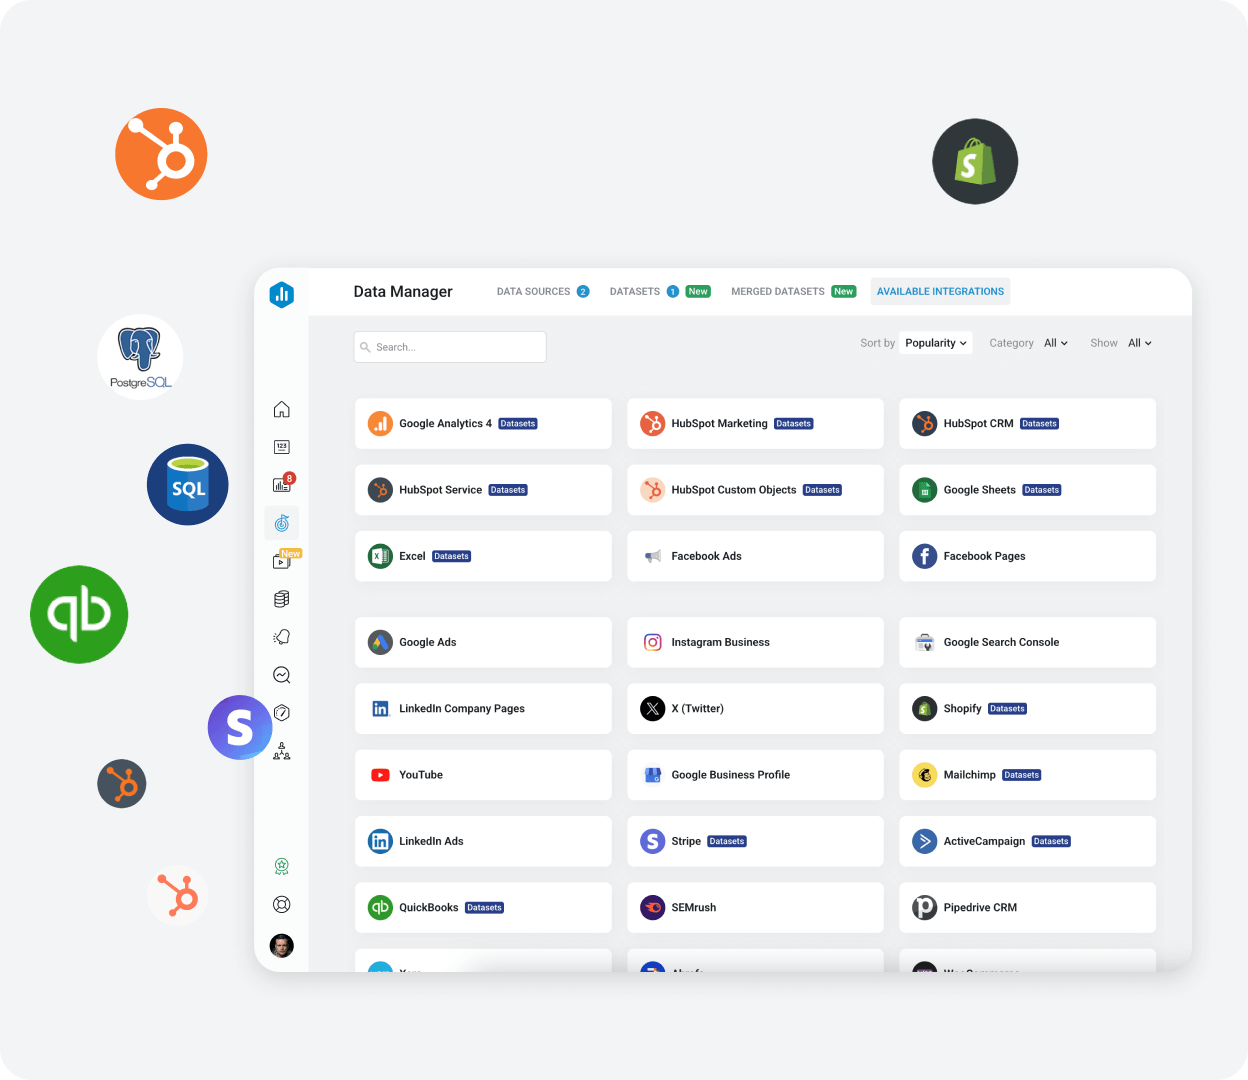
Can I actually centralize all of my data?
Looker Studio works well for Google data; anything else often means third-party connectors (at a cost) and a bigger budget than you expected. Databox connects 130+ sources out of the box, syncing your marketing, sales, finance, and custom data into one place — simply.
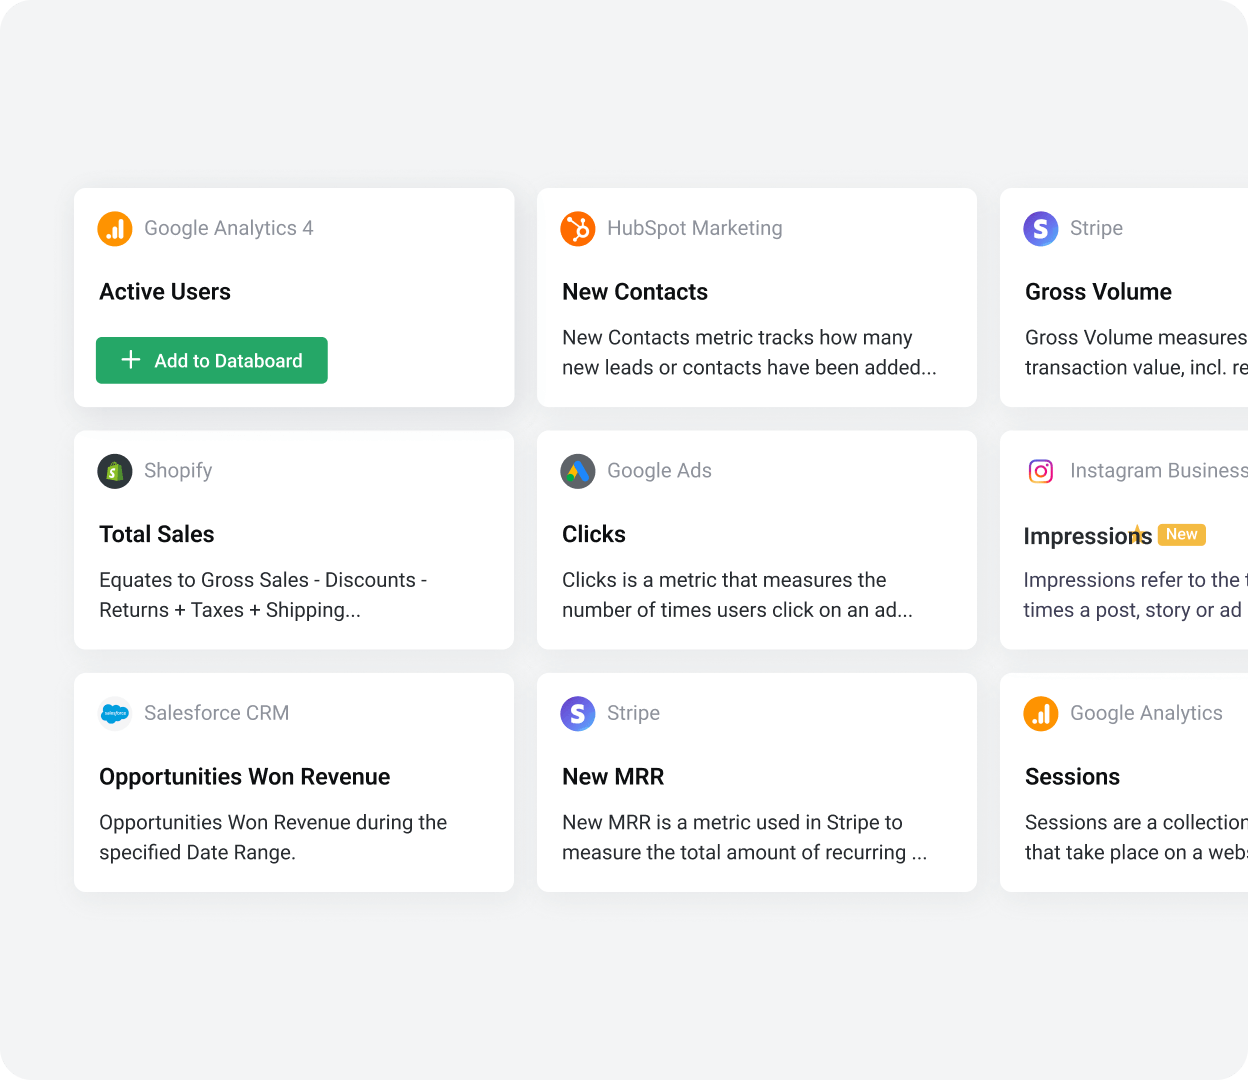
How long will it take us to build something useful?
Looker Studio setups can take more time and technical familiarity than teams expect. Databox helps you move faster with thousands of pre-built metrics, and templates that make getting started feel effortless.
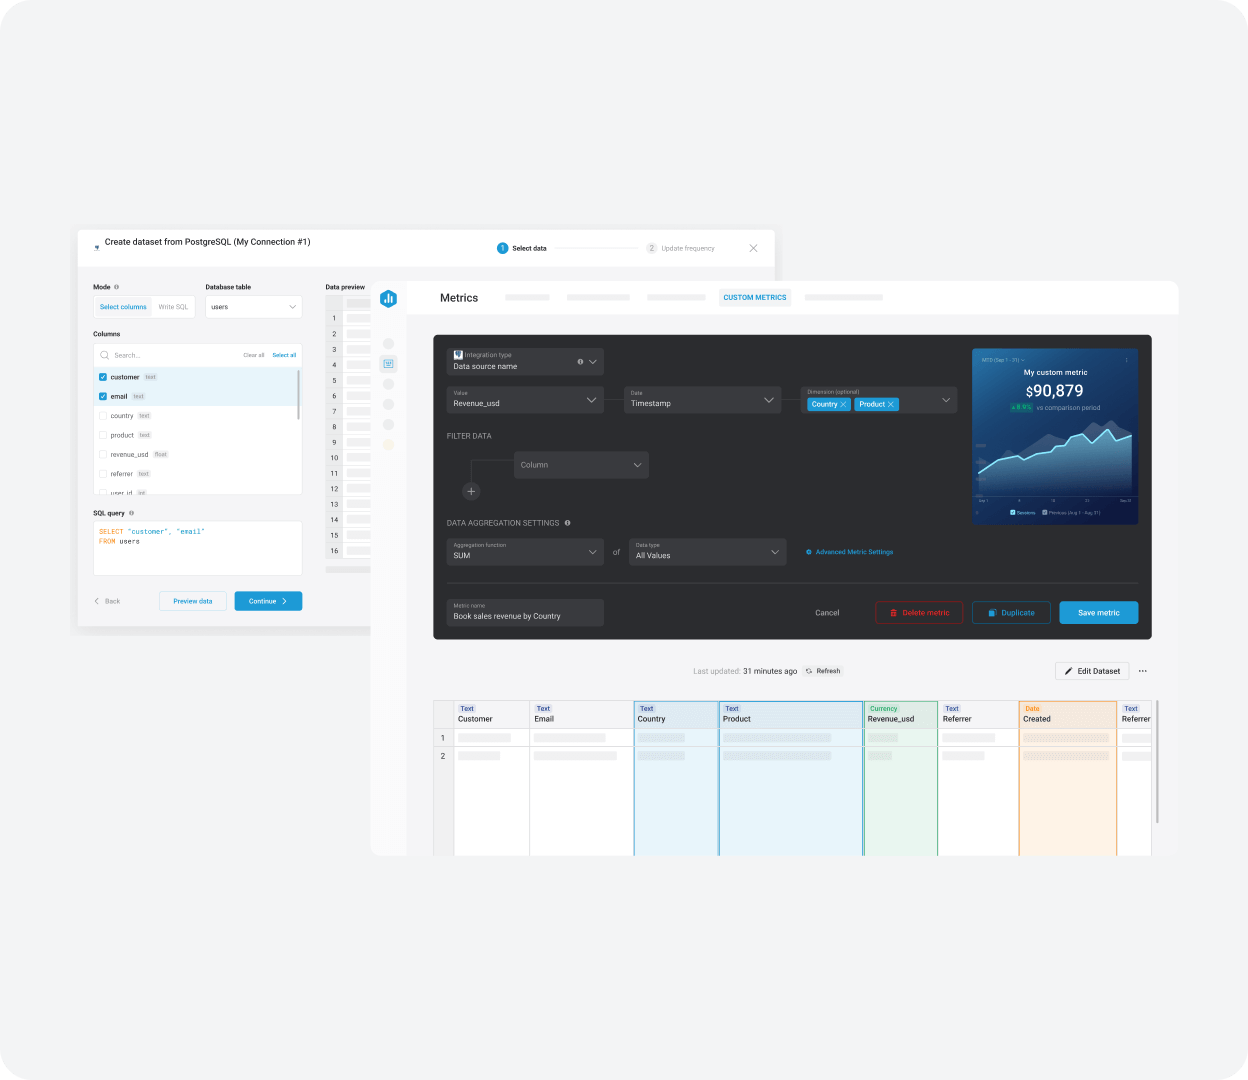
Can we easily customize what we need?
Customization in Looker Studio is overly technical. Databox gives you a no-code workspace to prepare data, create custom metrics, and tailor dashboards and visuals, so you can get the insights you need fast.
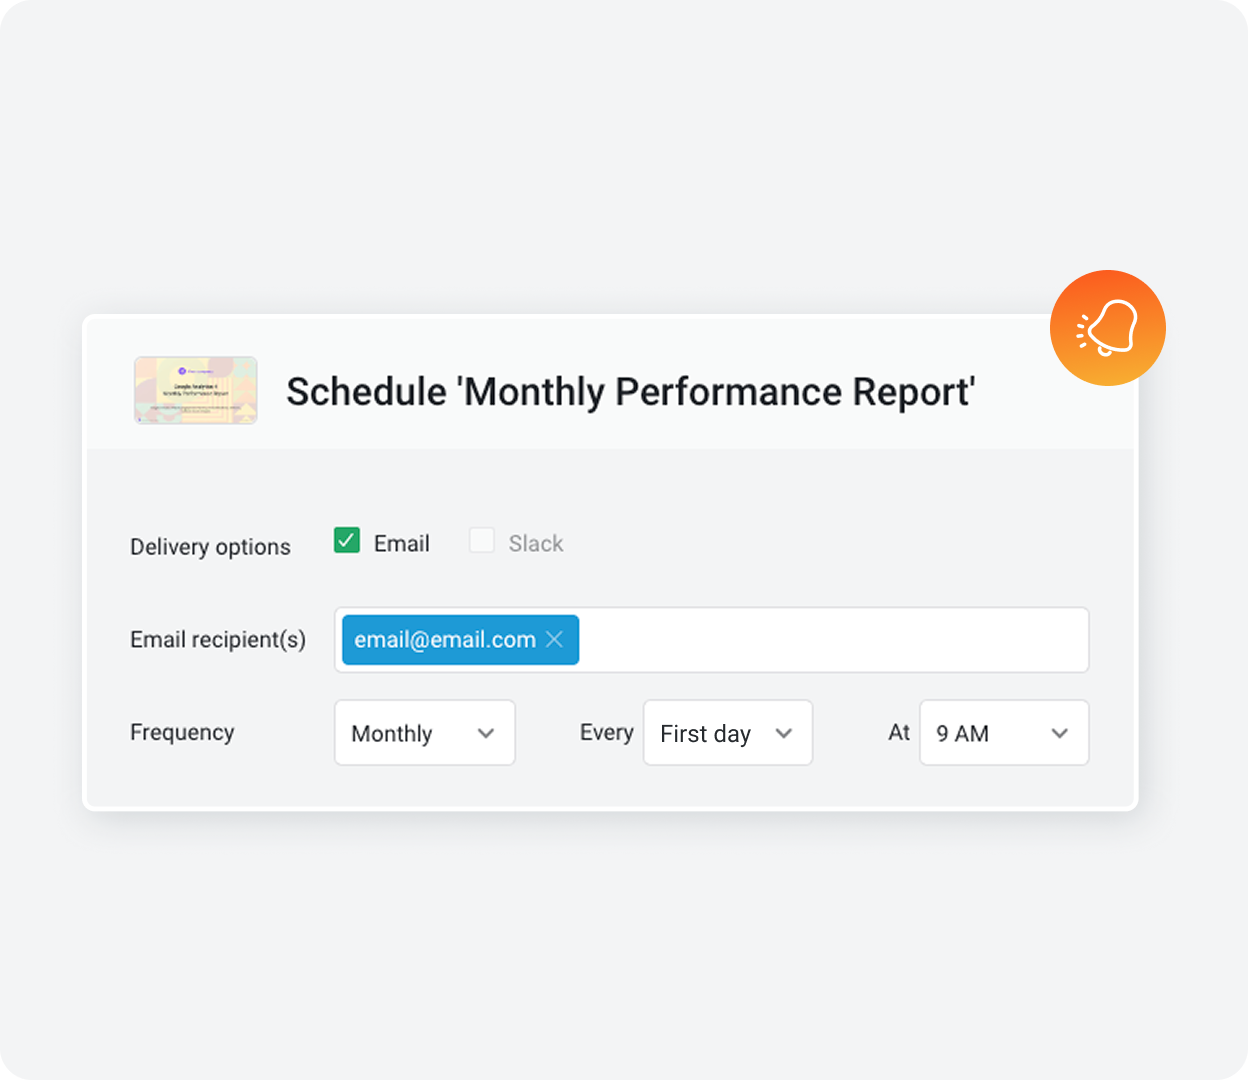
Will this still work as our data and team grow?
Looker Studio can become harder to manage as you add more data, dashboards, or users. Databox scales naturally with unlimited users on every plan, custom dashboard and report templates, and flexible sharing built for growing teams and clients.
Compare Databox vs. Looker Studio on what matters
Feature-by-feature breakdowns don’t tell the whole story. What matters is how quickly you can find insights, share them with your team, and self-serve with confidence.


Connect 130+ native integrations, spreadsheets, databases, and APIs to bring all your performance data together in one place.
Build datasets and reusable custom metrics without technical expertise. Easily standardize, filter, merge, and clean your data, then use custom metrics in dashboards, reports, goals, and more.
Create beautiful, branded dashboards and reports with clear visuals and ready-made templates. Display insights anywhere, including on your office TVs.
Explore performance with filters, drilldowns, comparisons, goals, alerts, anomaly detection, and AI summaries that surface what matters most.
Keep stakeholders aligned with automated email, Slack, and mobile updates. Share live, interactive dashboards and present reports in pageless or slide-based formats.
Use benchmarks, forecasting, and OKRs to connect strategy to performance and build plans with data.
Manage reporting across clients with dedicated accounts, role-based access, and an overview of every client’s metrics. Reuse templates, white-label your account, and automate at scale.
Switching from Looker Studio? We’ll make it effortless
Moving your data to a new platform can feel like a big, overwhelming task. That’s why we do the heavy lifting for you. Book a quick conversation with our team, and we’ll guide you through exactly what’s possible and what the migration would look like.


