ORIGINAL RESEARCH REPORT
The State of Annual Planning and Modeling
“Hitting the number” is one thing. But was it predictable and repeatable, or just a lucky guess?
In a recent research study by Databox and Lift Enablement, we asked 100+ mid-market go-to-market, RevOps, and finance leaders how they plan for predictable, repeatable growth.
The results revealed how leaders plan, model, and execute more predictably — and where most go wrong.

Planning vs Execution: Where Does Predictability Fail?
Predictability does not necessarily break because teams don’t model well, but because they plan on inputs that can’t be trusted, and execute with misaligned systems.
It’s not a matter of strategy vs execution. It’s that the system meant to connect the two is too fragile to support either.
If you want a predictable plan, you need to fix the foundation before the kickoff.
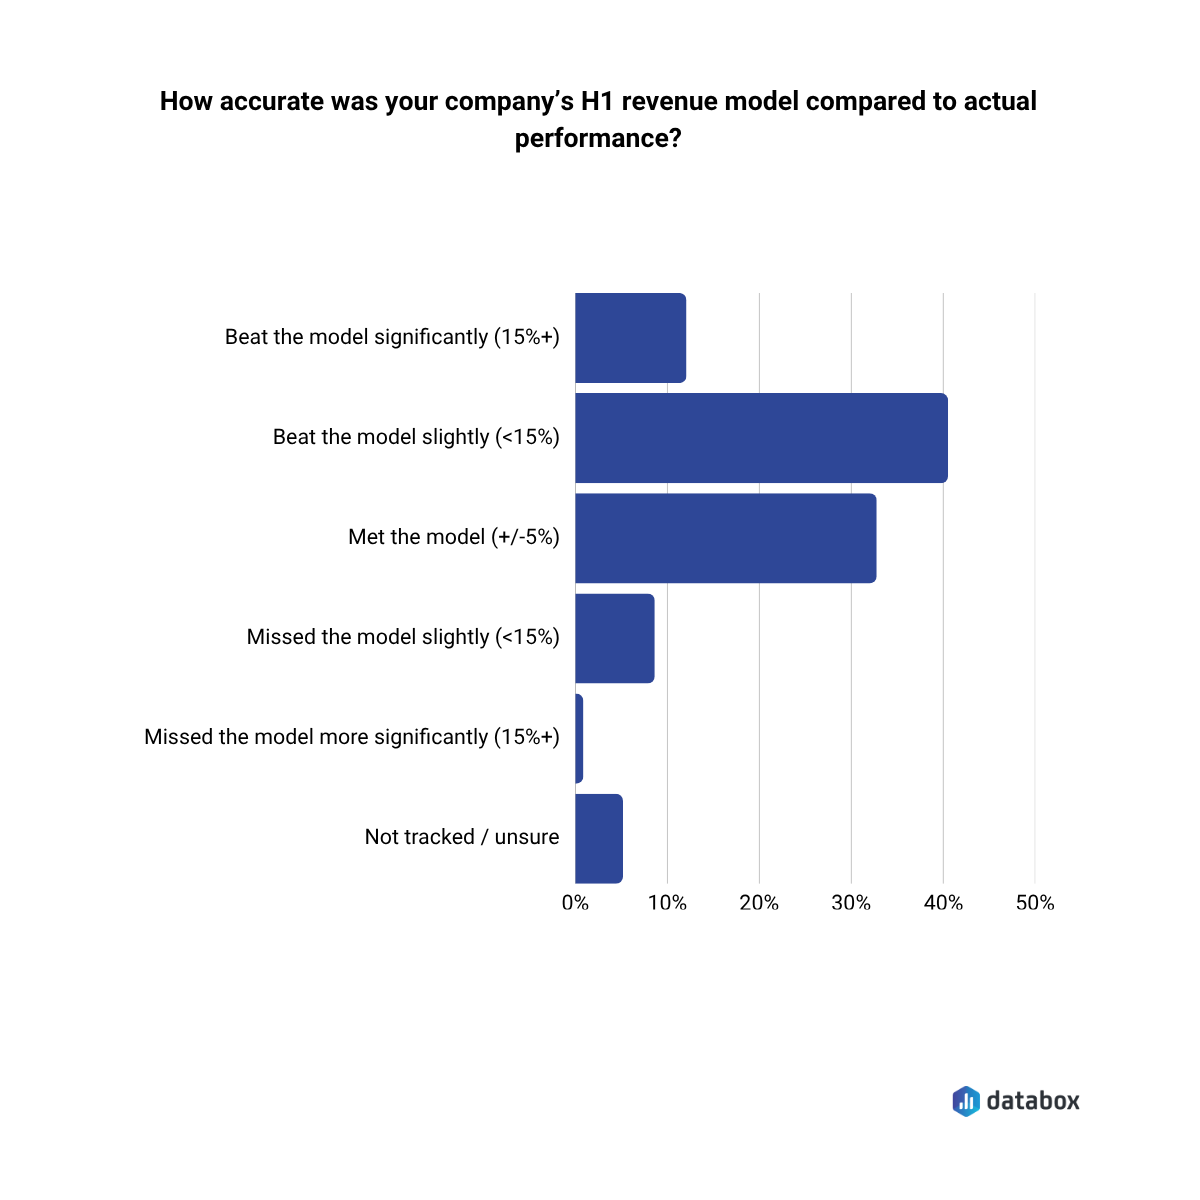
Are companies hitting their targets?
When asked how they performed against their company’s H1 revenue model, 85% of respondents said they met or beat their H1 revenue targets.
In other words: yes, the number may have been hit.
But that’s just part of the story.
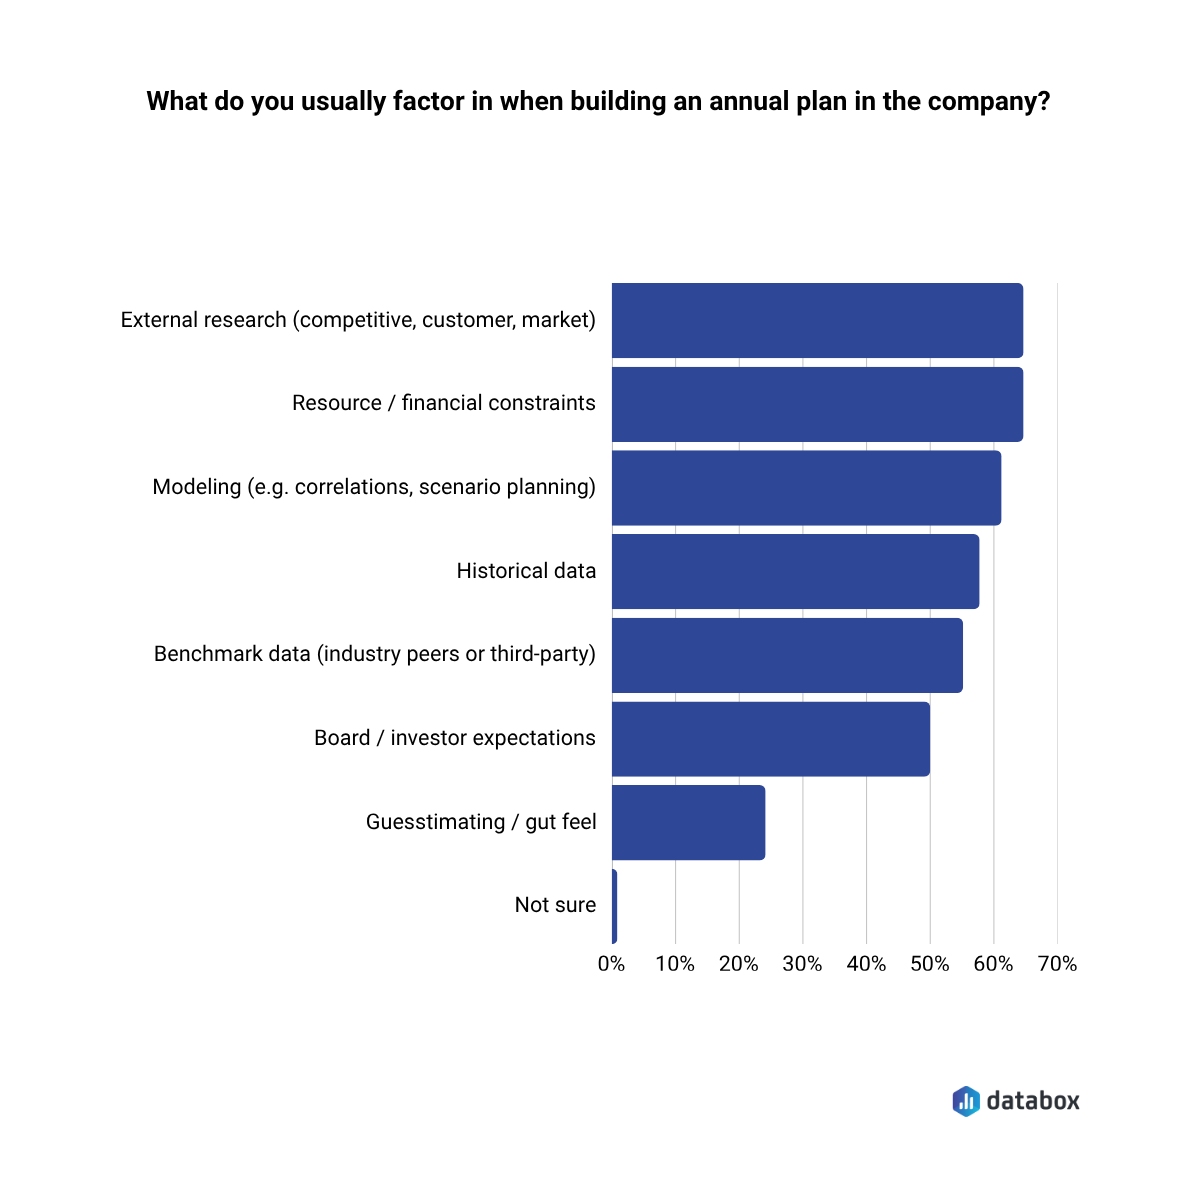
What inputs are factored into the annual plan?
Most companies say they build their plans on solid ground. The top inputs factored into annual plans include:
- More than 60% factor in external research, resource and financial constraints, and modeling (correlations, scenario planning)
- More than 50% are factoring in historical data and benchmark data
- Less than 30% say they rely on “guesstimating” or gut feel
On paper, these inputs look rational and methodical. But in practice, many teams start the year already on unstable footing.
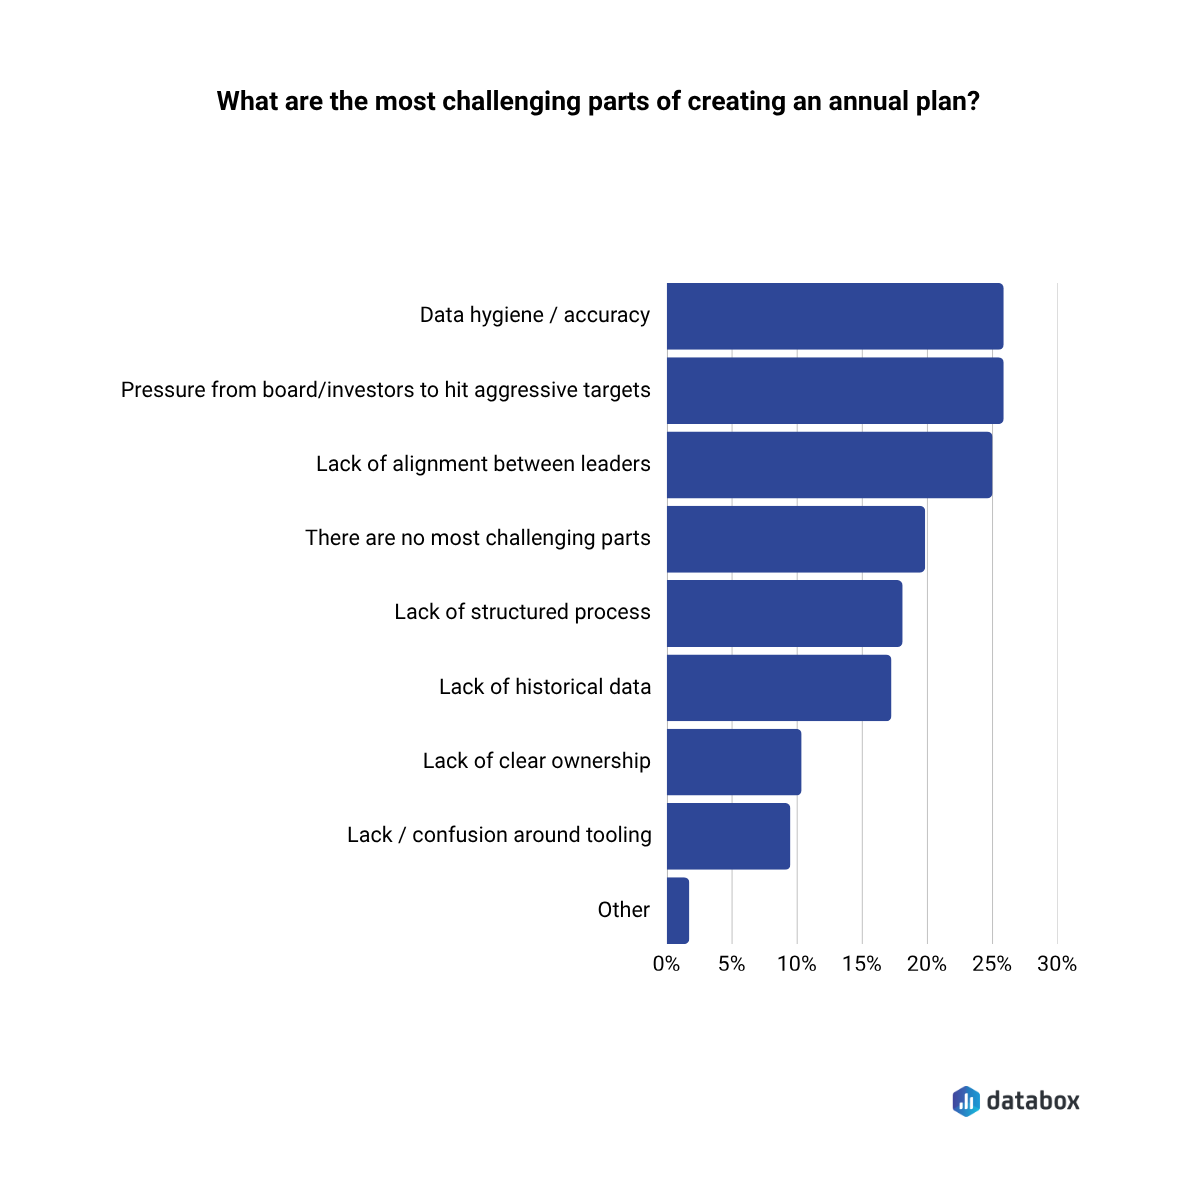
What are the top challenges in creating the plan?
When asked about the biggest challenges in building the plan, three issues rose to the top:
- 25% cite data hygiene and accuracy as a top challenge in creating annual plans
- 25% also say board and investor pressure to hit aggressive targets is a top challenge
- Nearly 20% say they struggle with lack of alignment between leaders
These challenges are not modeling issues, but system and process issues. It means that before a single initiative launches, the planning process is under strain from conflicting priorities, questionable data, and unstructured collaboration. And once the plan moves into execution, the pressure compounds.
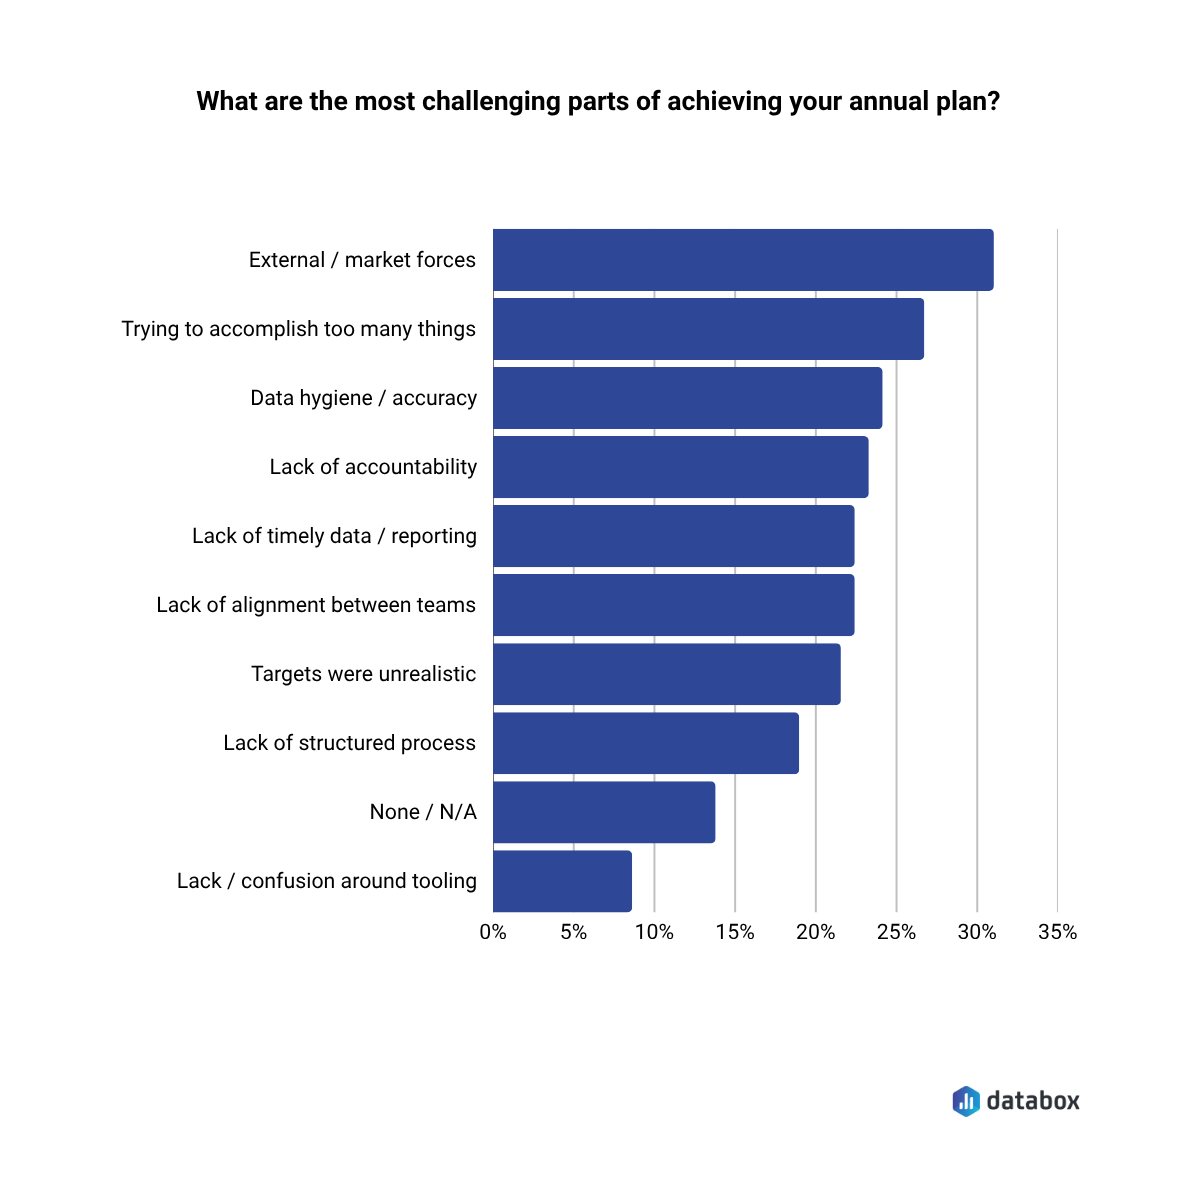
What are the top challenges in achieving the plan?
While more than 1/3 of respondents say a top challenge in achieving the plan is external / market forces, the other top blockers to achieving the plan are internal:
- Trying to do too many things
- Data hygiene, again – this time in execution
So while the strategy may look sound in the planning deck, it often launches with:
- Misaligned expectations
- Messy or missing data
- Unrealistic initiative load
Strategy is a human process, no matter how data-informed we make it. We bring our anxiety about change, our trust and distrust of those involved, and our beliefs about what is allowed and not allowed. The CEO sets the emotional and creative tenor of the space, and everyone will determine how much of themselves to bring to the work based on both the structure and the actions of the leader.


Most plans inspire but don’t instruct
Predictable Scale course teaches OGI – turning strategy into objectives, goals, and initiatives that actually run the company.

Initiative Overload: How Many Major Initiatives Are Too Many?
Overloaded systems are inherently fragile. The more an organization tries to do, the harder it becomes to prioritize, spot early signals, and course-correct with speed.
Predictability improves when teams cut scope, align around fewer priorities, and reduce noise.
How many major initiatives are companies running at one time?
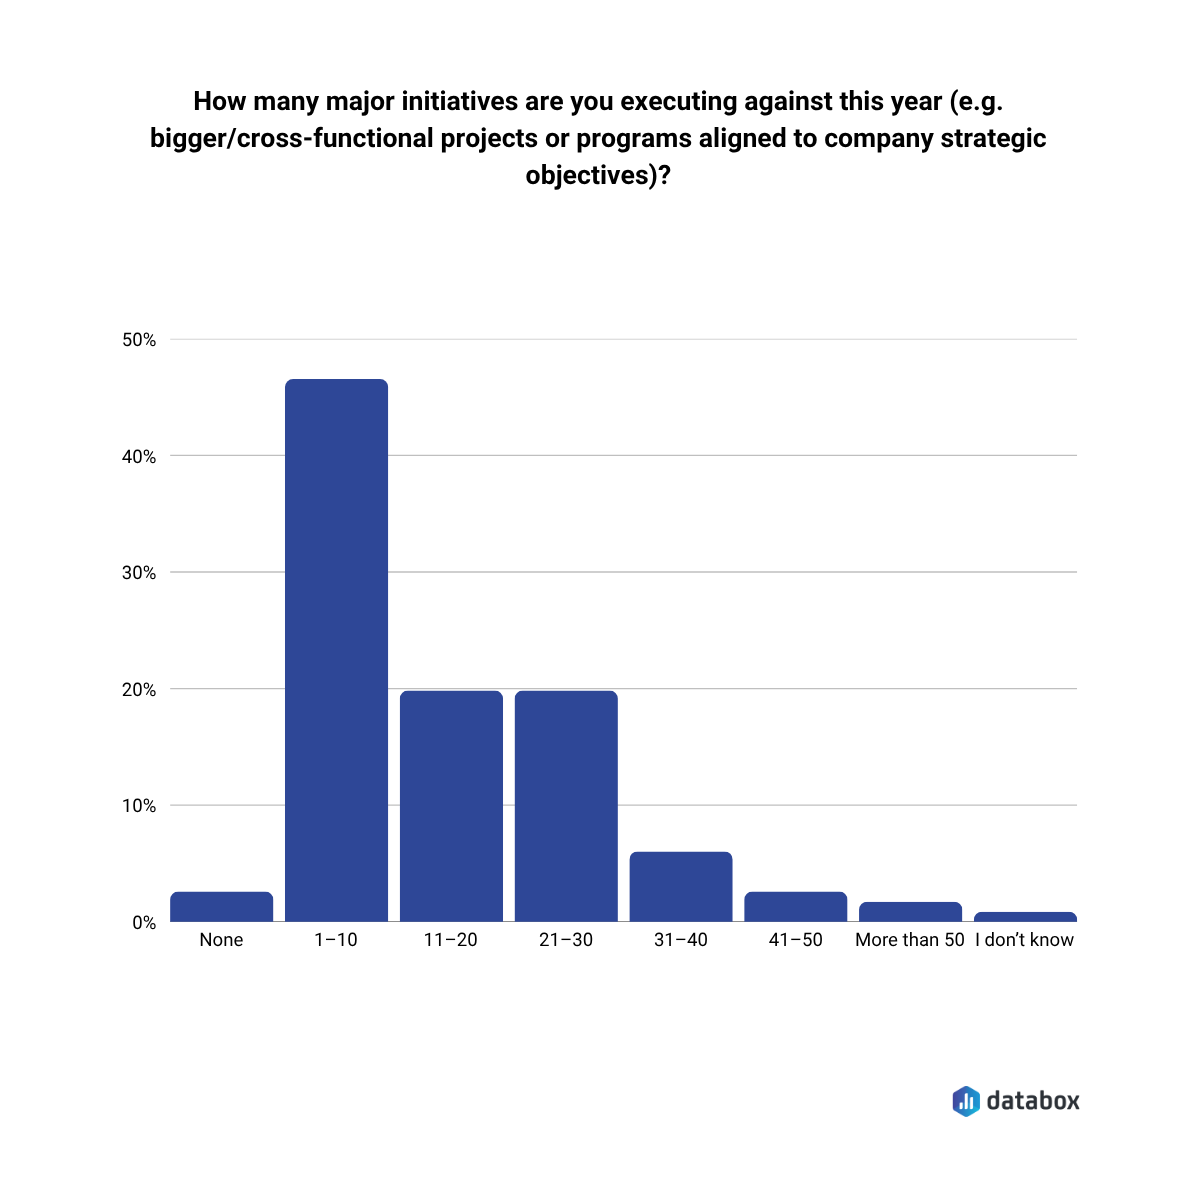
In our data we saw that:
- Nearly 1 in 3 companies are running 21+ major initiatives
- Some reported 40 or more strategic projects in motion at once
And this isn’t just anecdotal: “too many initiatives” is one of the top three blockers cited by respondents trying to execute the plan.
Transparency Is Still Uneven: Who Should Have Access to Modeled Scenarios?
Transparency isn’t just cultural. It’s operational. If the plan lives in a silo, it won’t survive the year.
Companies with shared dashboards and visible scenarios are better positioned to flag risks early, adjust with confidence, and maintain alignment as things evolve.
How transparent are the final forecast models?
In many companies, visibility into the forecast model (final projected numbers) is limited:
- Less than 50% of companies say everyone sees the same numbers (high transparency)
- 34% report selective transparency of the forecasted models (selective transparency)
- 14% limit final model visibility to execs only (low transparency)
When teams can’t see the full range of modeled outcomes, they can’t help stress-test assumptions or course-correct when reality shifts. That kind of opacity makes it hard for frontline teams to align, adapt, and steer their own work toward the company’s real goals.
And it’s not just about access. It’s about trust.
Who sees the scenario models?
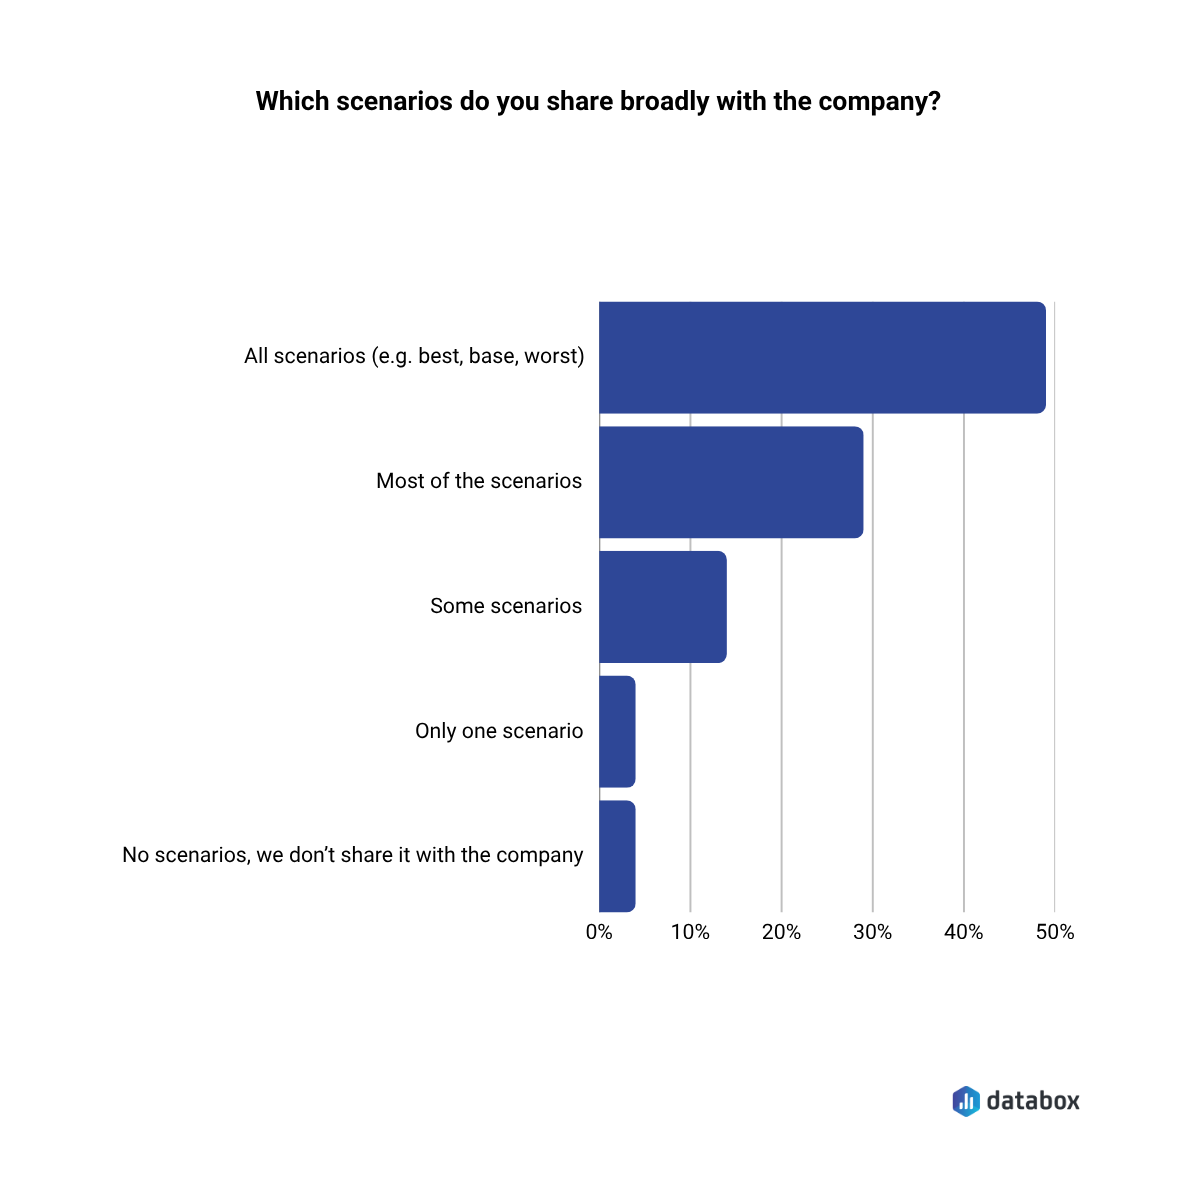
Scenario sharing follows a similar pattern:
- 49% share all scenarios across the organization
- Others share just “most,” “some,” or even none
If predictability is the goal, the plan can’t be protected. It has to be shared.
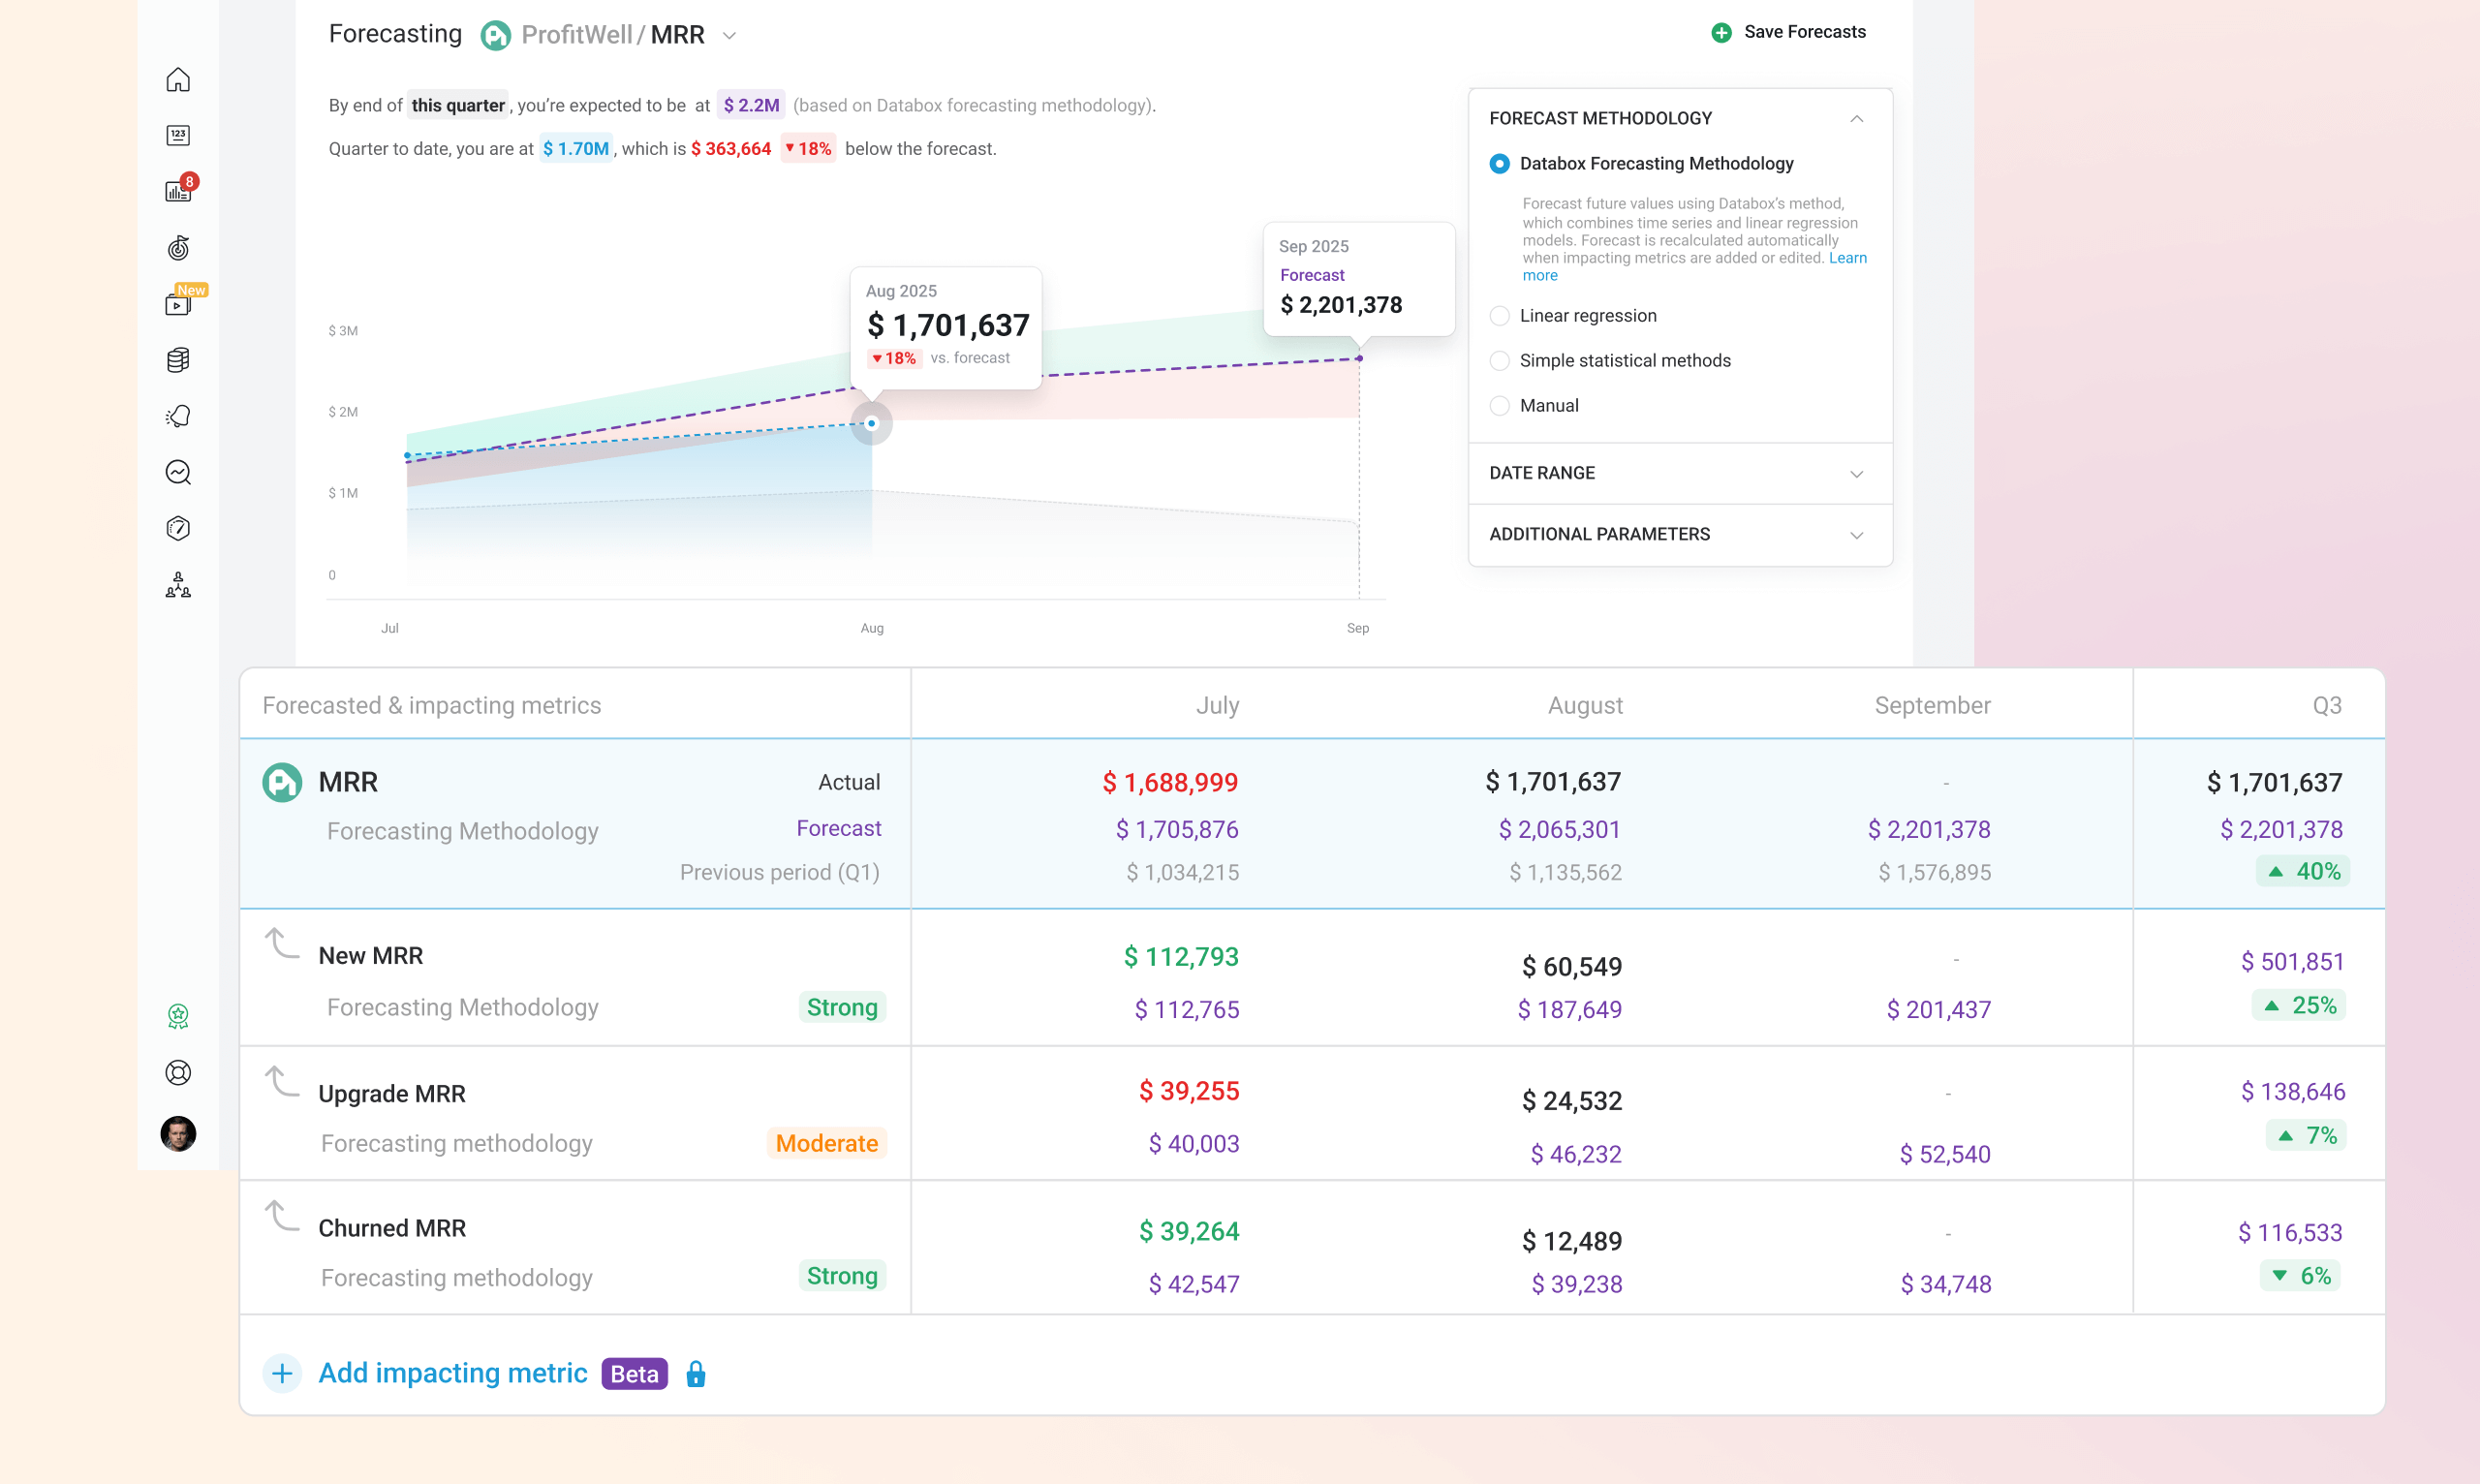
Test assumptions and build forecasts your team can trust
Set targets based on reality, not optimism, with Forecasts.
Seasonality Is Changing: When Should Planning Happen to Increase Agility?
The idea of a “planning season” used to anchor most annual cycles: Q4 strategy offsites, January kickoffs, April budget refreshes. However, that rhythm seems to be fading.
There’s no single season anymore. And that’s not inherently bad. It just raises the stakes for building cadence into the process, so teams don’t lose their alignment, discipline, or momentum.
While the start month of annual planning may not matter all that much, planning rituals certainly do.
Predictability requires rhythm, even when the calendar doesn’t cooperate.
When does the annual planning process begin?
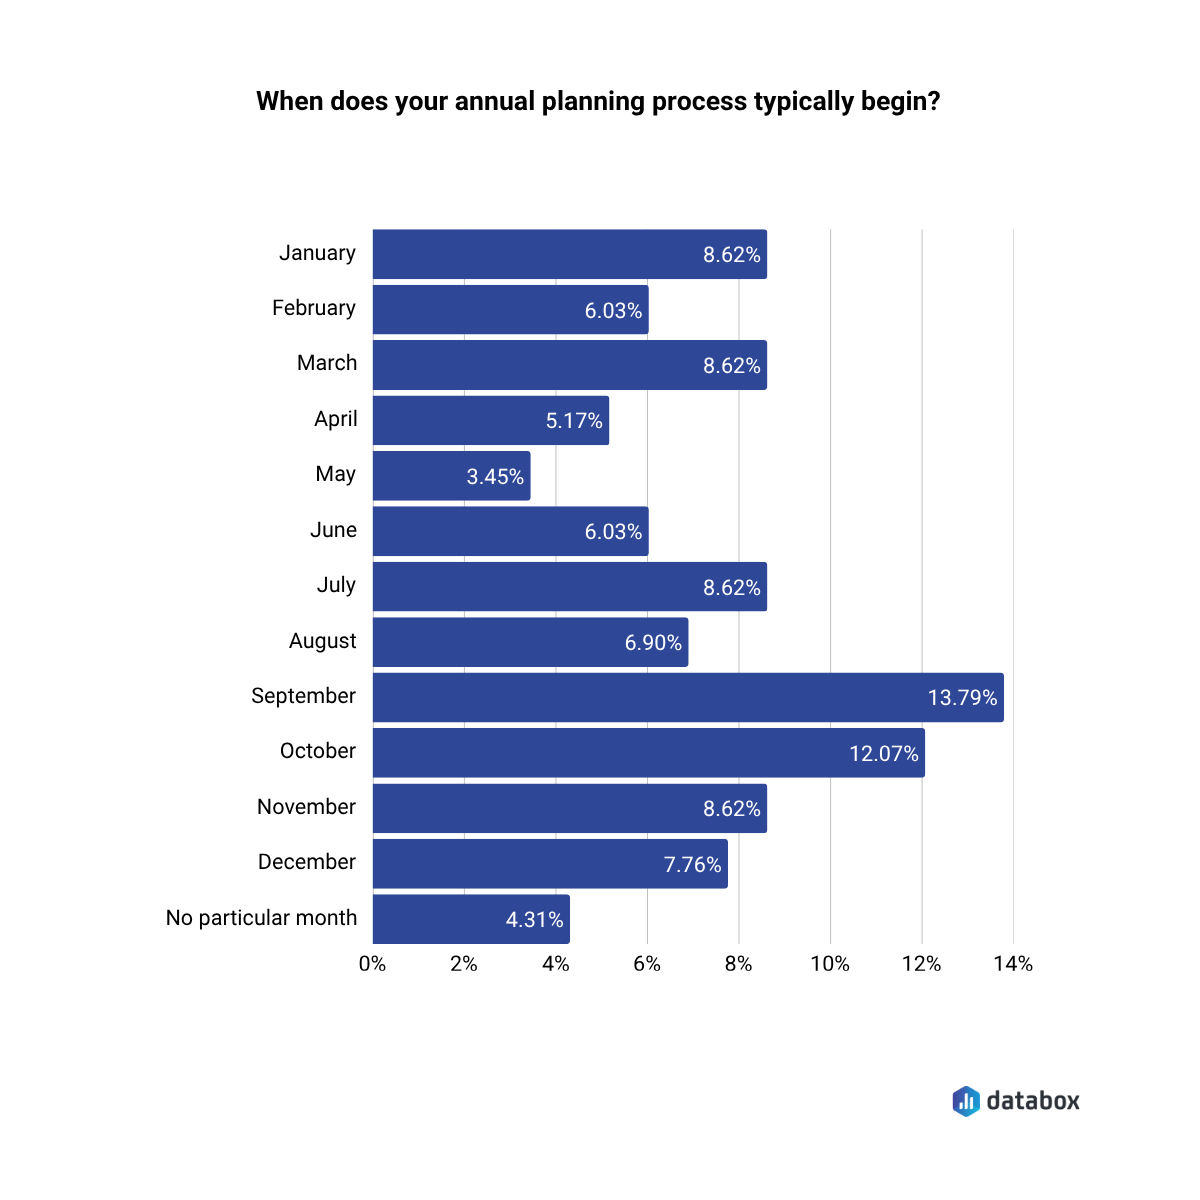
While early fall (September, October) still dominates as the kickoff time for annual planning, teams also reported starting their annual planning in nearly every month of the calendar year.
September, October, and November were fairly common, but so were March, July, and even “no particular month”
As Aygul Mehdiyeva from Vitamail shared: “We stopped using one big yearly plan and moved to a rolling plan. Now we check and adjust every quarter. This helped us see problems earlier, fix them faster, and make our targets more realistic.”
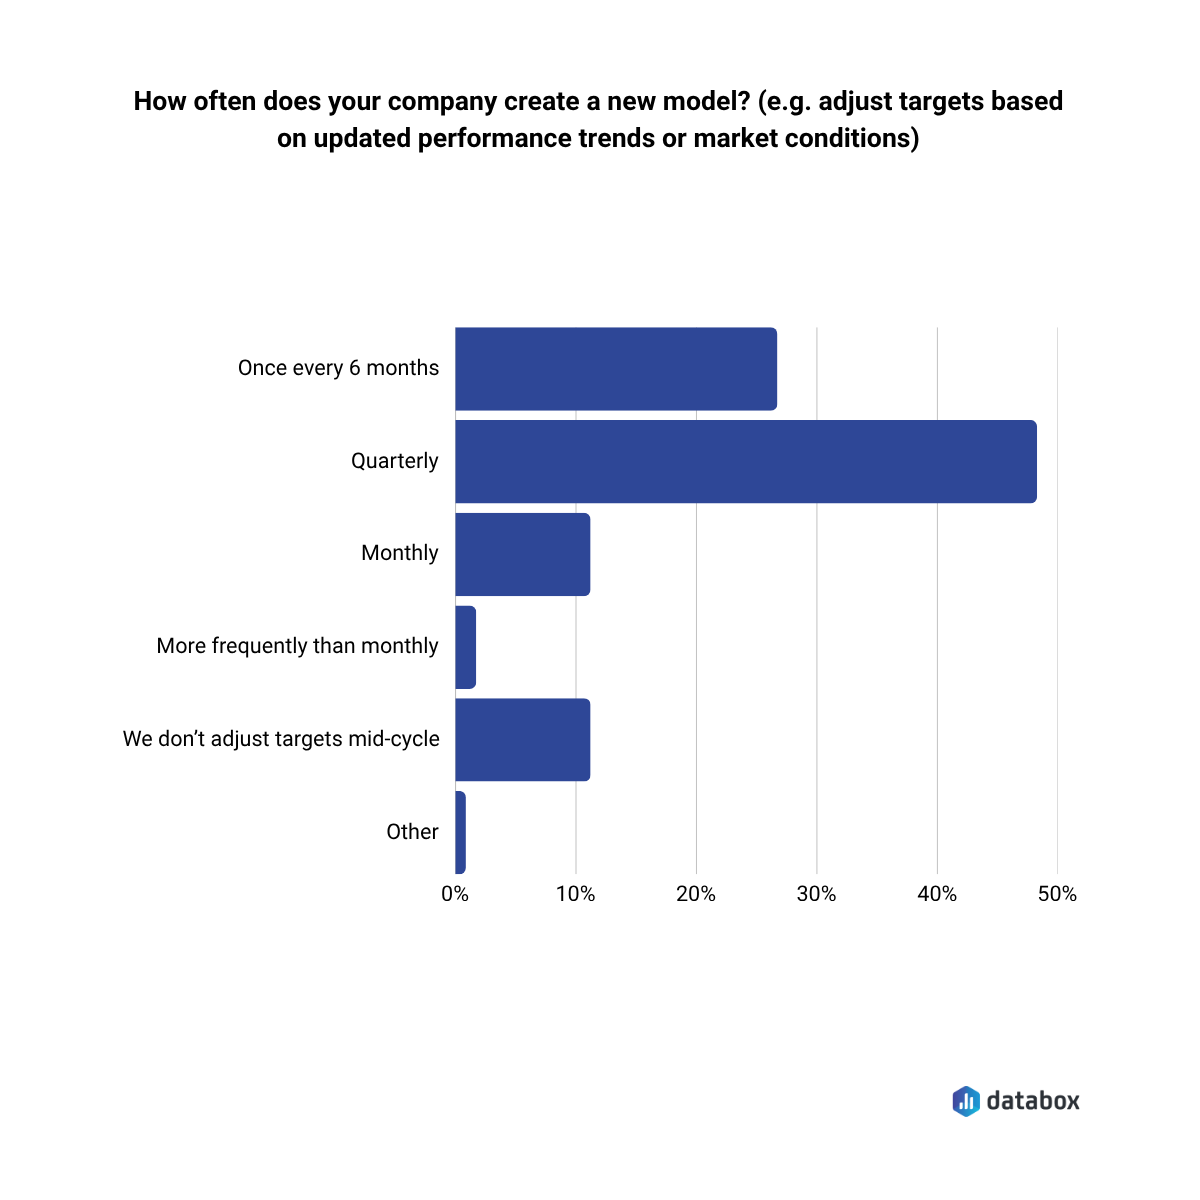
How often do companies create a new model (adjust targets)?
Quarterly model updates are the norm for nearly half of respondents, but others still operate on 6-month or slower cycles, risking misalignment when conditions change mid-cycle.
Spreadsheets Still Dominate: What Tools Build the Greatest Trust?
When data is centralized and surfaced through shared dashboards, visibility, accountability, and agility all improve. And yet 72% of teams still rely on spreadsheets.
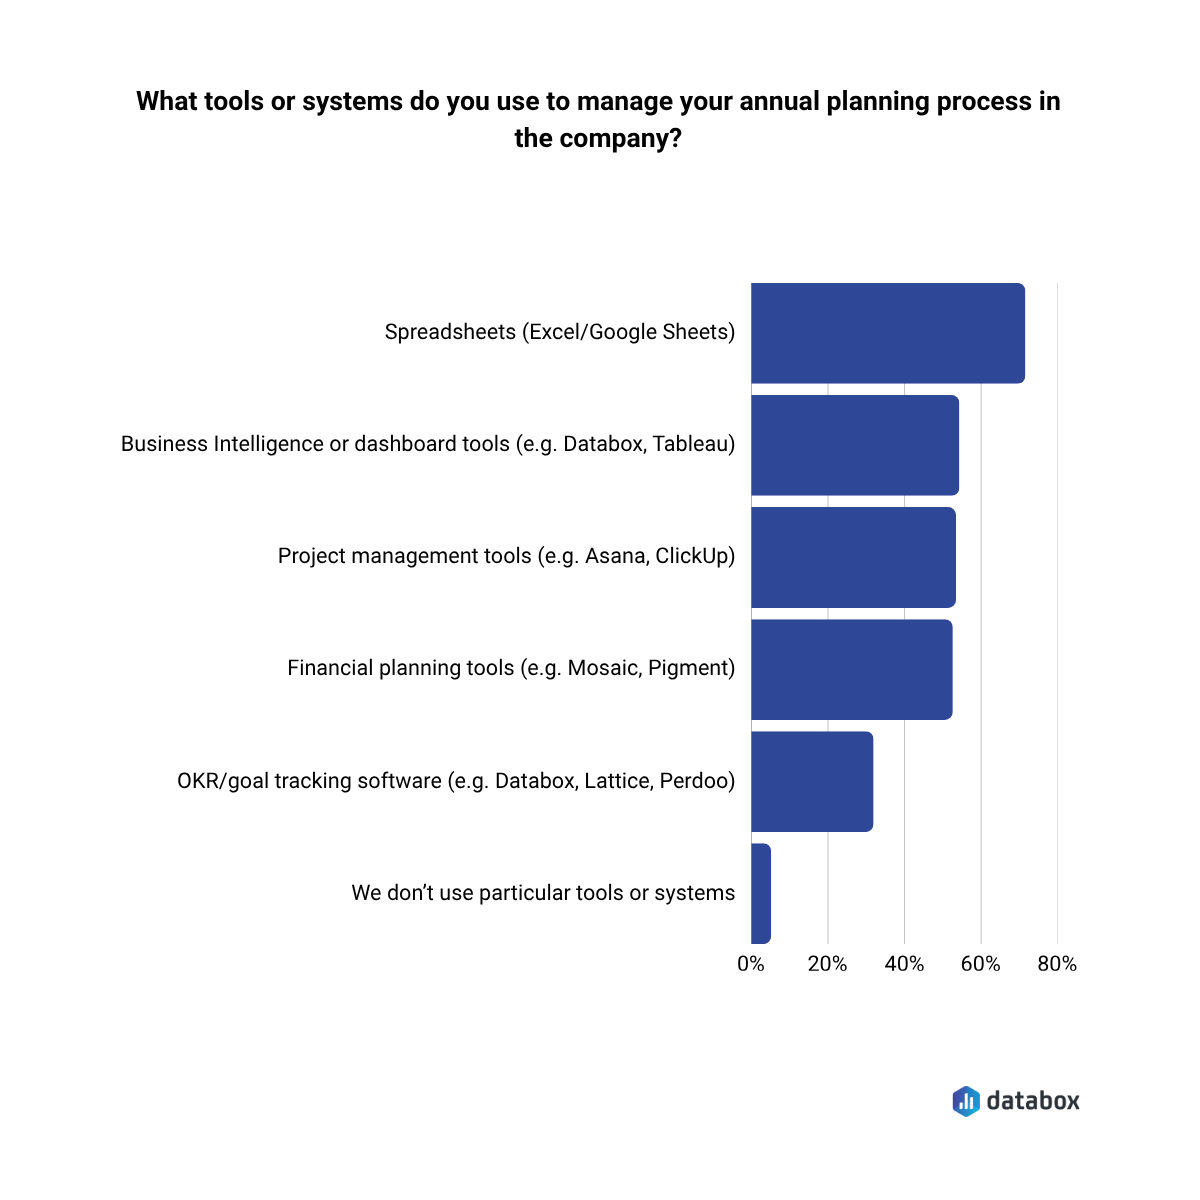
What tools or systems do teams use to manage annual planning?
72% of teams use Excel or Google Sheets as a primary tool.
Spreadsheets are flexible. But they don’t scale transparency, governance, or collaboration on their own.
So, it’s a good indicator that teams also layer in other systems:
- 54% use BI platforms
- 53% use PM tools
- 53% use FP&A software
- 32% use OKR systems
Predictability isn’t built in a spreadsheet. It’s built through connected, visible systems.
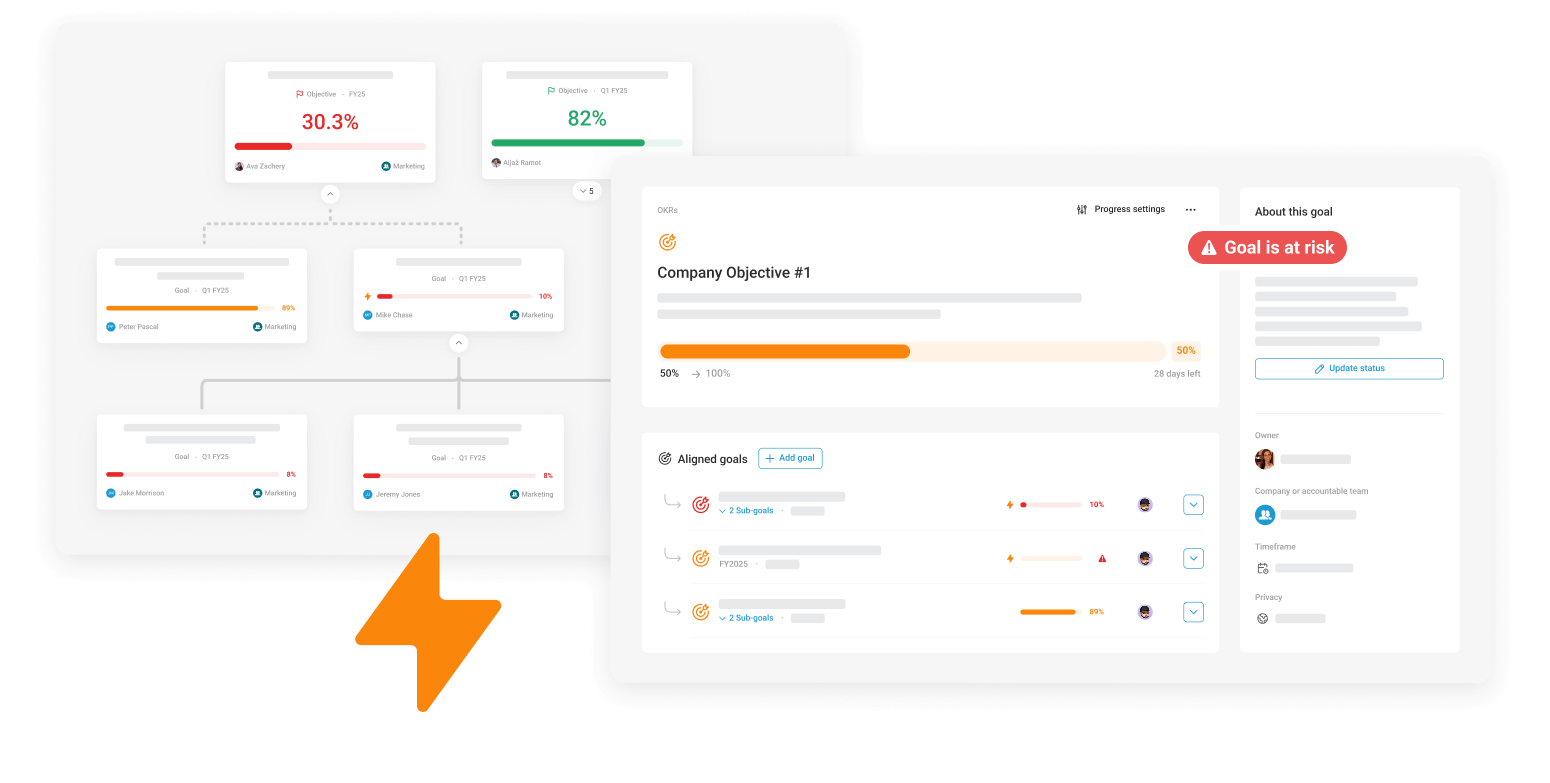
Define clear objectives and set measurable goals
Give every team visibility into how their work contributes to company success with OKRs.
About the Research
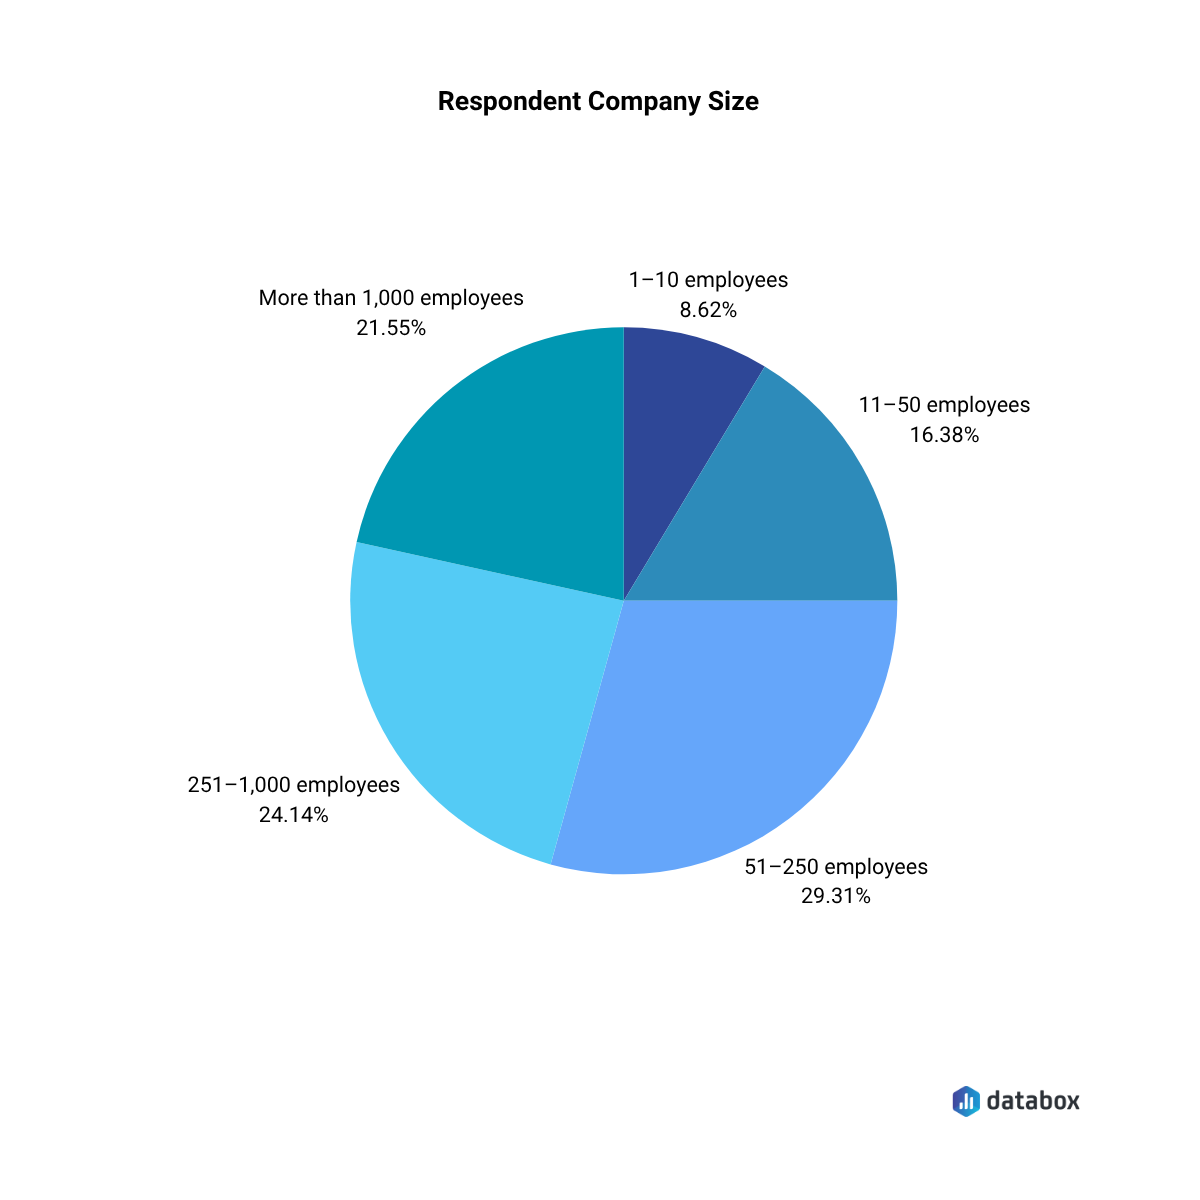
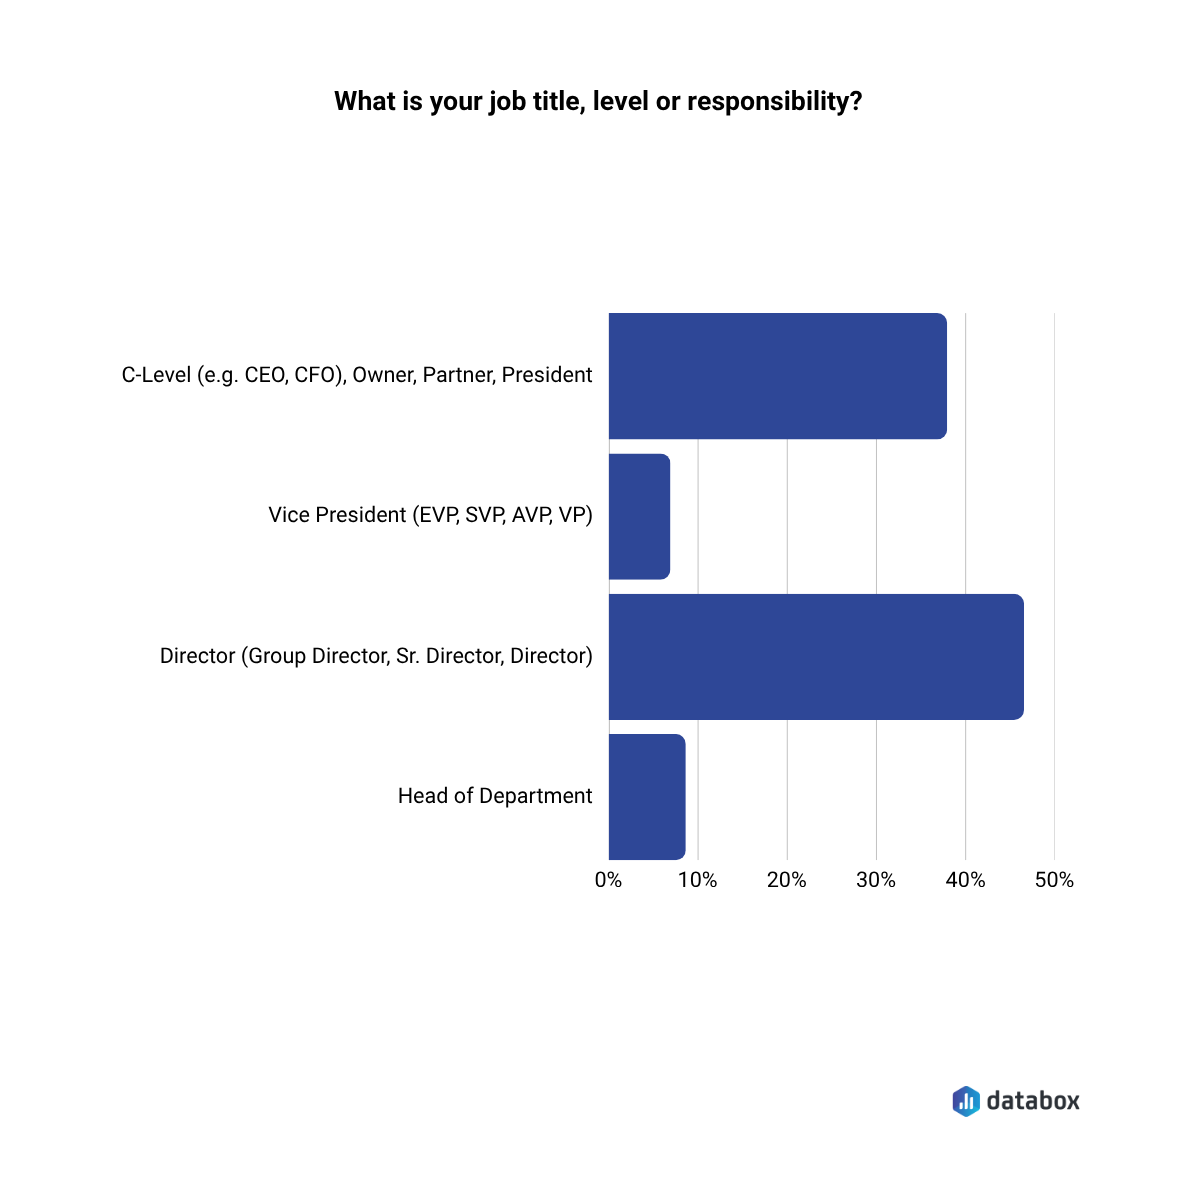
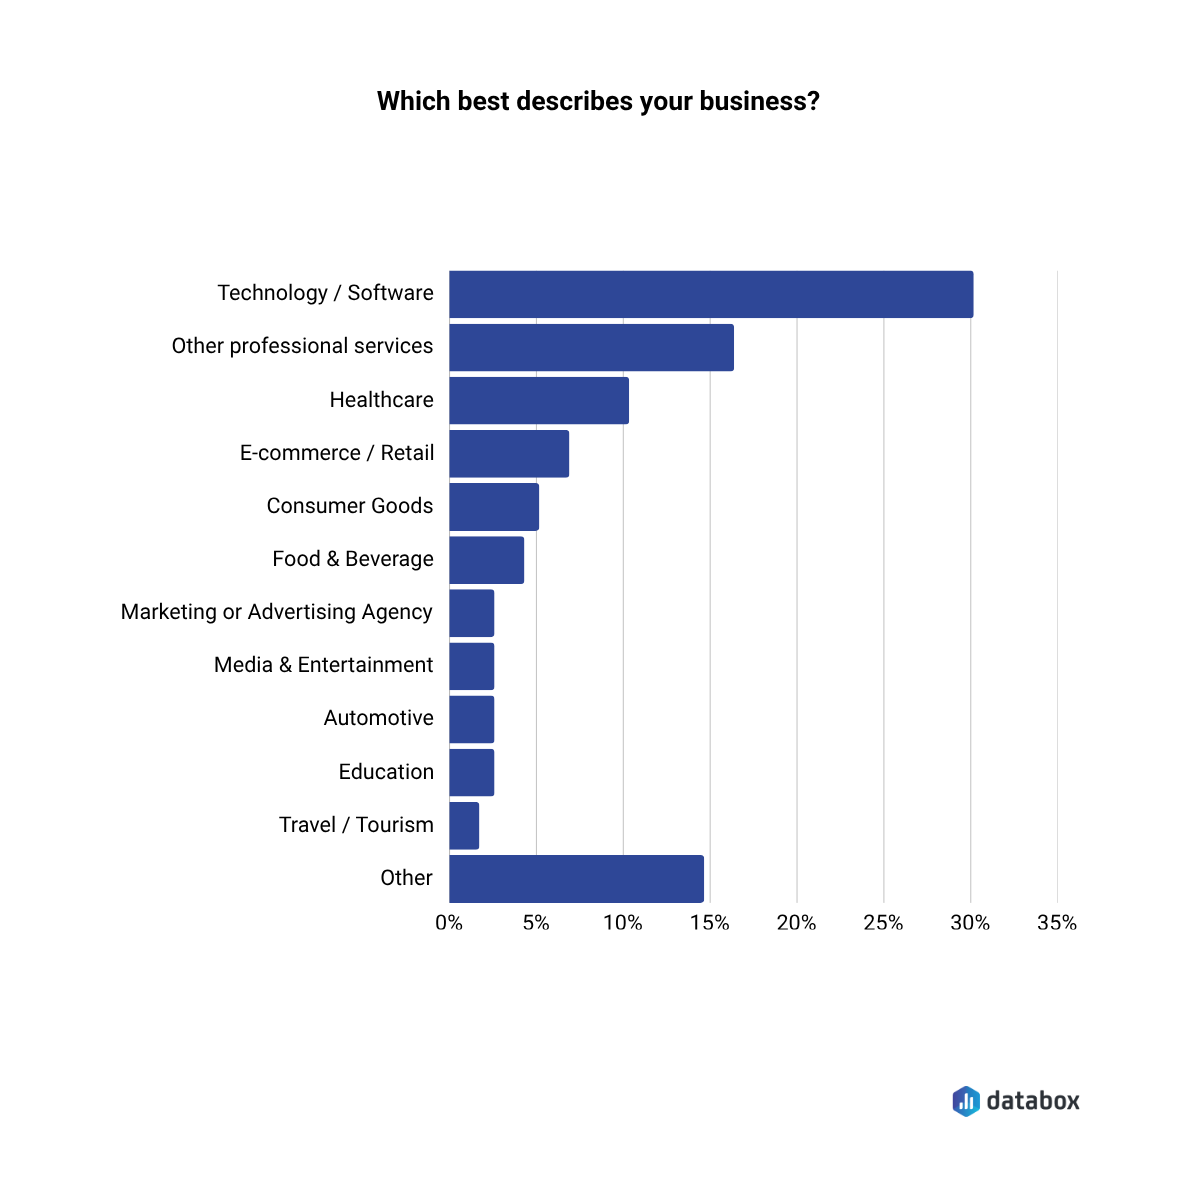
This study includes responses from 100+ leaders across mid-market organizations (50–1,000 employees), each with direct involvement in annual planning, modeling, and execution.
Download the full report!
By submitting the completed form, you agree to our Terms of Service and Privacy Policy


compliant
certified