All ecommerce dashboard templates come pre-built with some of the most commonly tracked metrics from the most popular tools. You can customize your templates at any time.
Get a high-level overview of your online store from the most popular sales tools from our library of pre-built templates. Just download any template, connect your data, and get instant visualizations of things like your store’s transactions, revenue, conversion rates and more.
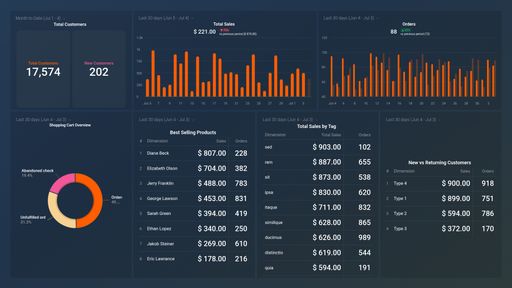
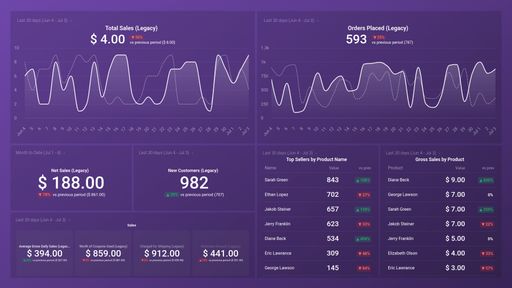
Shopify Sales Performance
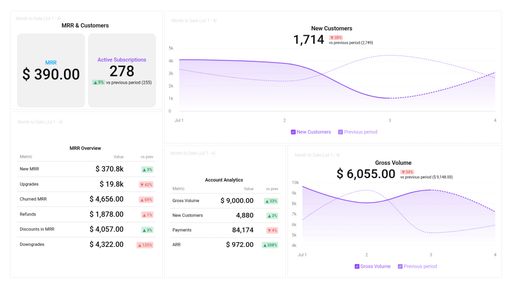
Stripe MRR & Subscriptions Overview
WooCommerce Shop Overview
Google Analytics 4 Ecommerce Overview
Ecommerce Sales Dashboard Examples and Templates
Track the performance of your online sales from the most popular sales tools from our library of pre-built templates. Just download any template, connect your data, and get instant visualizations of things like pipeline conversion rate, number of orders, gross revenue, session value by channel, average order value and more.
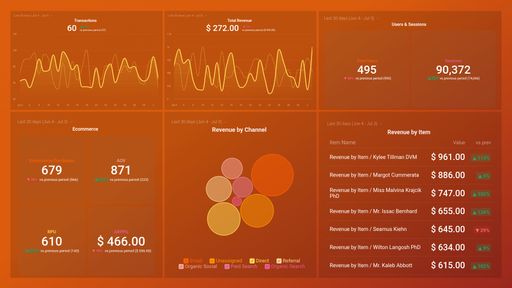
Shopify Sales Performance
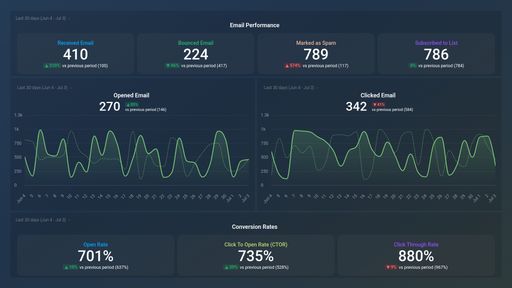
Klaviyo Email Performance
Stripe MRR & Subscriptions Overview
WooCommerce Shop Overview
Paid Ads for Ecommerce Dashboard Examples and Templates
Track how sales affect the development of your business from the most popular sales tools from our library of pre-built templates. Just download any template, connect your data, and get instant visualizations of things like New Contacts, New Leads, New MQLs, New SQLs Deals Created, Deals Won, Closed Won Amount and more.
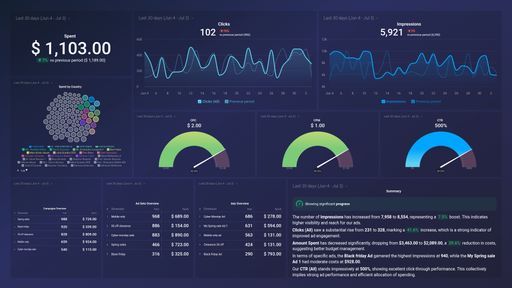
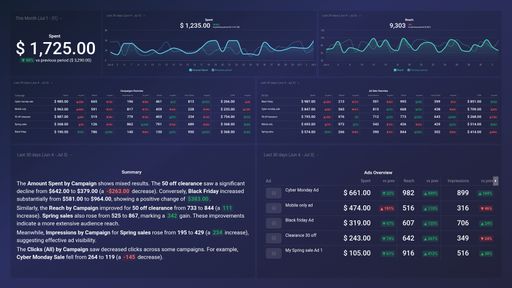
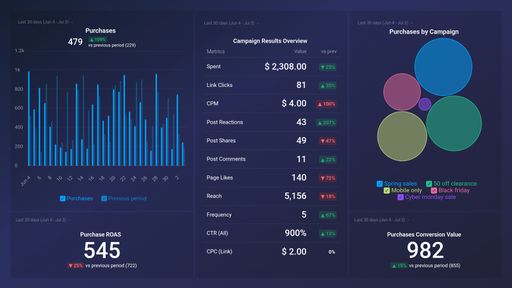
Facebook Ads Performance Overview
Facebook Ads Campaign Drill-down
Facebook Ads Campaign for Ecommerce
Google Analytics 4 Ecommerce Overview
Ready to visualize your marketing performance?
Build your dashboard with our DIY Dashboard Designer now.
Explore all the different ways you can use Databox to gain better data insights needed to drive better business decisions. Here are just a few examples of the departments and industries that use our pre-built templates on a daily basis to improve performance.
An ecommerce dashboard displays a set of metrics, KPIs, and other data that’s specifically designed to highlight trends, anomalies, and information related to online store performance. The purpose of an ecommerce reporting dashboard is to surface just the most important information its viewers might care about.
With the help of an ecommerce dashboard, ecommerce experts are able to get actionable data on all online store transactions, conversions, generated revenue, average order value, and much more.
What Should Be Included in an Ecommerce Dashboard?
A comprehensive ecommerce dashboard should include data about your transactions, conversions, generated revenue, and average order value. Additionally, an ecommerce reporting dashboard should show historical data regarding total sessions, average order value, gross revenue, cart abandonment rate, and similar in order for others to see how things are trending over time.
A carefully crafted ecommerce dashboard should help inform your strategy by answering who are your visitors and where do they come from, how many people have purchased from your online store, which products are the most popular, how does your sales performance compare month over month, and more.
How to Interpret Your Ecommerce Dashboard
If you are an executive that oversees an e-commerce business, one of the best ways to optimize the performance of your store is to monitor real-time data for your online business.
And you need only one ecommerce dashboard for that, but it has to be a good one. As an example, we will break down and interpret data from this Ecommerce Overview dashboard template that integrates with Google Universal Analytics, MailChimp, AdWords, and Facebook Ads.
The focus will be on interpreting data to better understand how different factors may affect monthly revenue for your e-commerce store.
Note: If you operate on monthly planning, consider focusing on the month-to-date timeline, compared with equal days in the previous month. The real magic doesn’t come from constantly looking at where you are right now, but rather, looking at what has changed since the last comparable period. Change provides context, helping you immediately see where you’re doing better and where you need to improve.
Calculating and Understanding Monthly Revenue for Your Online Store
Understanding your ecommerce big picture comes down to a single, simple formula:
revenue = sessions * ecommerce conversion rate * average order value
Revenue is simply a mathematical function of the traffic you’re generating to your site, your conversion rate, and your average order value. Just by understanding this simple formula, you can instantly pinpoint the problem if your revenue is declining. Or, you can identify impactful changes when it’s increasing.
In this simple example, revenue is down by 29% month to date. What happened?
Simple. While the ecommerce conversion rate is more or less the same and average order value actually increased, we have a mission-critical problem with sessions decreasing by 34%.
Now, no simple dashboard will give you all the answers on a single screen, but this is enough for you to start digging deeper, identifying the traffic sources or channels that decreased the most in traffic.
Digging Deeper into Your Traffic Channels
Next, it’s time to dig deeper into individual traffic channels. A simple report can show you which channels are doing better (or worse) in terms of revenue, again compared to the previous period.
After that, it’s just a matter of digging deeper in Google Universal Analytics to get more insight into why they’re underperforming (traffic, conversions, average order value) and then optimize.
This data block uses the »channel« dimension from Google Universal Analytics to give a revenue breakdown. Make sure that you’ve properly set your channel data to capture each individual traffic channel you care about.
No Data Point is an Island
You should not be worried necessarily when a certain channel, like Facebook advertising, is generating less revenue. Lower revenue can sometimes mean means higher profits, for example, if you manage to decrease your cost per customer acquisition.
That’s why it’s a good idea to always include the channel cost data for your biggest channels in your report. In this case, we’re looking at paid Facebook advertising and Google CPC, however, you should spend some time integrating the channels that matter to you.
Just make sure that you don’t ignore the cost side, because revenue by itself isn’t the only figure in the profit equation.
Keeping a Daily View of Your Key Revenue Channel
One or more of your channels might be so important or specific that you might actually want to keep a daily chart for the channel, for example, like here, a chart with daily email sales and new email subscribers.
You can also make a chart with daily Facebook revenue and costs, or even a chart where you create a calculated metric for revenue from all of your paid channels and compare it with a calculated metric from all of your paid advertising costs.
Monitoring Best Selling Products
The reason for your decreasing or increasing sales might not always be in your activities, but in certain products going out of season or into season. It’s critical to keep a careful eye on your top movers and shakers to react on time and change your strategy.
Use the Top Products data block for a quick glimpse at your bestsellers to see which are growing and which might be going down. Then simply consider the possible causes.
Is it still the right season for the products you’re pushing?
Are competitors doing something you should be aware of?
Are your individual product campaigns performing worse than in the past?
Looking at bestseller movements provides much-needed context to your overall and channel performance.
Ultimately, every dashboard you use needs to tell the specific story of your business and what's driving it. Think of the dashboard template we just went through as a starting point. Then adapt it to the specifics of your business. Remember, always focus on your key business drivers, whatever they may be.
How to Create a Ecommerce Dashboard
Create a new dashboard using our Designer tool
Create a new dashboard using our Designer tool
Name your dashboard
Name your dashboard
Select a data source
Select a data source
Drag-and-drop pre-built metrics from that source to your dashboard
Drag-and-drop pre-built metrics from that source to your dashboard
Customize each metric block
Customize each metric block
Haven’t found what you’re looking for?
Whether you are looking for client reporting dashboards, agency dashboards, marketing dashboards, or sales dashboards, Databox can help you build them.
Let us know what you are trying to build and our team of experts will help you turn your data into actionable insights.