Interactive Data Visualization: Create Dashboards with Databox
Stop tracking your company’s performance in spreadsheets, 7+ software tools, and slides. Start visualizing your data with Databox to see the big picture.
Trusted by 20,000+ growing businesses


See how Databox can help you with data visualization
We Want to Centralize, Organize, and Monitor All Our Data with One Spot
Problem
Your data is scattered across multiple platforms, making it difficult to get a comprehensive performance view. This creates inefficiencies and delays in decision-making, as managers spend too much time gathering and consolidating data.
Solution
Databox integrates data from all various sources (130+ integrations) into one unified dashboard. This centralization allows real-time monitoring of company-wide performance metrics, fostering quicker, more informed decision-making. Easily spot trends and critical areas needing attention—all from one platform, without needing a data analyst or coding skills.
We Want to Create Visually Appealing, Easy-to-Understand Reports Without an Analyst
Problem
Generating insightful reports is often time-consuming and requires specialized skills. Many teams find it challenging to present data in a visually appealing and comprehensible manner, complicating effective communication with clients and stakeholders.
Solution
Databox enables you to create beautiful, customized dashboards and reports without any coding skills. Use pre-built templates or design your own, incorporating visual elements that make your data easily digestible. With Databox, you can transform raw data into compelling stories that highlight your agency’s success and resonate with clients.
We Want to Reallocate Valuable Time from Manual Reporting to Strategic Initiatives
Problem
Manual reporting processes are time-consuming. This time could be better spent on strategic planning and execution. This inefficiency not only reduces productivity but also limits the ability to quickly adapt to changing market conditions.
Solution
Automate your reporting with Databox and free up valuable time for your team to focus on strategy and execution. Schedule regular reports to be automatically sent via email or Slack, equipped with the latest data and insights. With automated dashboards or reports, you can reduce the time spent on manual data compilation and concentrate on driving growth and improving client outcomes.
We Want to Easily Identify Areas for Improvement and Prioritize Actions
Problem
Many companies face challenges in identifying which areas need improvement, determining what to prioritize, or deciding on specific actions to take. This uncertainty can result in missed opportunities and inefficient resource allocation.
Solution
Databox offers powerful analytics and visualization tools that clearly highlight KPIs and trends across all your data sources. With customizable dashboards and benchmarks, you can effortlessly pinpoint underperforming areas and prioritize actions for maximum impact. Real-time alerts and performance summaries provided by Databox keep you updated on emerging trends, enabling proactive decision-making and continuous improvement.
We Want to Improve Stakeholder/Client Relationships with Data-Driven Insights
Problem
Stakeholders, including managers, team members, and clients, require various types of data to make informed decisions. Efficiently gathering and presenting this data in a unified way is often challenging and time-consuming.
Solution
Databox simplifies the creation of custom dashboards and reports tailored to the unique needs of different stakeholders or clients. Whether providing comprehensive overviews for executives or detailed metrics for team members, Databox enables precise customization of data presentations. By delivering relevant, data-driven insights Databox supports improved decision-making across the organization.
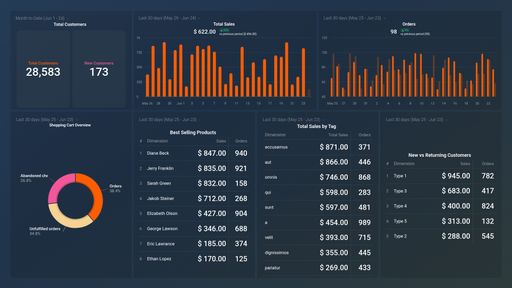
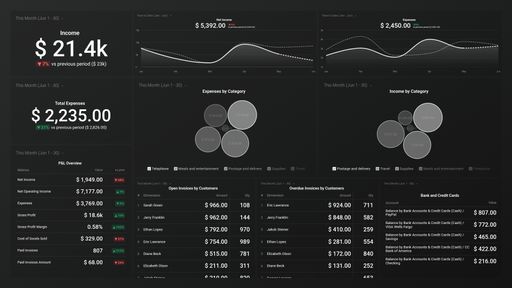
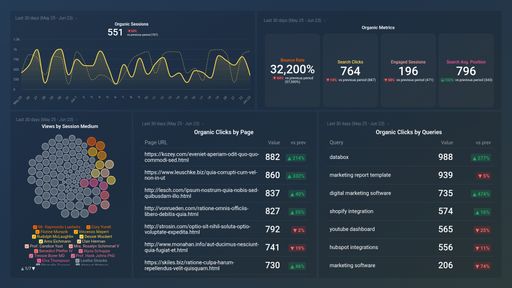
Create No-Code Dashboards Without an Analyst

-
Drag & drop your metrics
-
No-code editor
-
Fully customizable
“At Databox, we’re obsessed with helping businesses more easily monitor, analyze, and report client results. Whether it’s the resources we put into building and maintaining integrations with 100+ popular marketing tools, enabling customizability of charts, dashboards, and reports, or building functionality to make analysis, benchmarking, and forecasting easier, we’re constantly trying to find ways to help our agency customers save time and deliver better results.”

-
CEO at Databox and creator of HubSpot’s partner program, pioneering the agency growth model
-
Helped hundreds of agencies and their clients achieve measurable ROI
-
Key player in scaling HubSpot’s channel sales to over $100M ARR
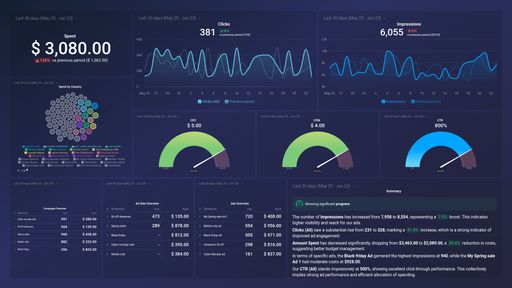
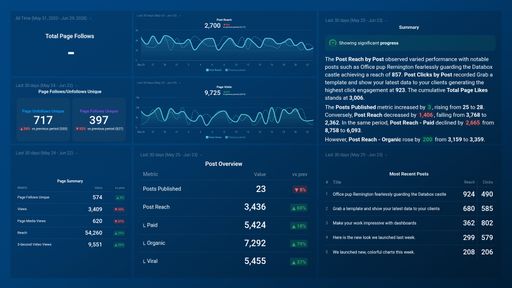
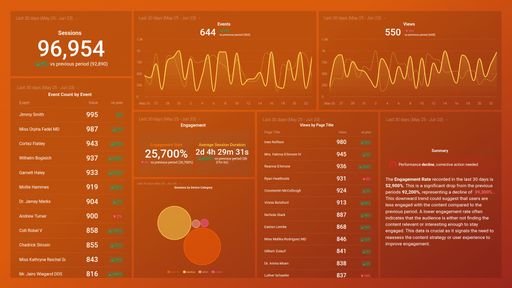
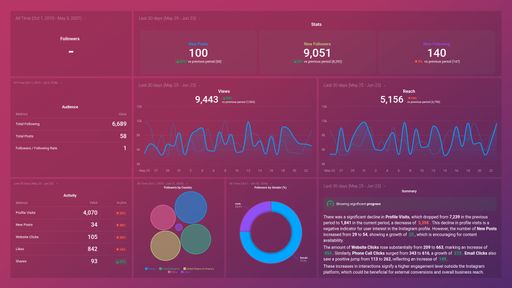
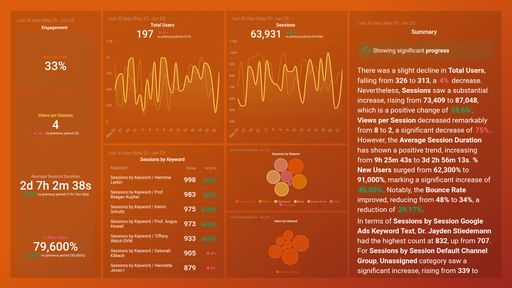
Visualize your data to see trends and opportunities more clearly
Find the perfect type of data visualization to help viewers understand performance more clearly and spot insights they couldn’t see before.

See Our Most Used Features in Action
Pre-Built Templates & Metrics
- Easily access over 4,000 pre-built metrics from 130+ integrations, and connect your account to start tracking or build your custom metrics. Then, choose from over 300 dashboard templates to quickly create and customize dashboards to your needs.
No-Code Custom Dashboards in Minutes
- Effortlessly build and share stunning dashboards that bring ads to sales metrics into focus. Provide insights that explain performance trends and give your team or clients constant access to real-time data, enhancing transparency and trust.
Automated Reports That Save Hours
- Ditch manual report preparation and automate it by scheduling updates directly to email or Slack, complete with the latest dashboards, images, and text. Plus, receive reminders to review everything before it goes out, ensuring your reports are always accurate and up-to-date.
Create your first dashboard in 1 click


Gather your team around the numbers
Automatically send the visuals, data, and context needed to make informed decisions. Compare performance across periods and access or share dashboards anytime to provide the necessary data and insights for planning your next steps.

Compare current performance to multiple previous periods
Look back at multiple previous time periods, so you can do deeper analysis.

Check your dashboards anytime, anywhere
View how your team is performing anywhere, with our mobile app.

Project your dashboard to a TV
Share dashboards on TV screens to continuously display real-time performance, or present to your team or clients.
Most Popular Integrations at Your Fingertips


And if you need important metrics from a different data source, no worries. You can connect powerful software integrations, APIs, Databases and custom Spreadsheets.
"Databox is easy to use and allows us to use templates or create our own completely custom dashboards to track KPIs from many sources. It's a great way for our team to get an overview of marketing performance and identify trends quickly.”


Frequently asked questions
What is Databox?
Databox is a powerful data visualization business analytics software that allows you to create customized, interactive dashboards. It helps you gather, analyze, and present data from various sources in one unified platform, making it easier to monitor performance and make data-driven decisions.
Can I start free - what’s included in the free version?
Yes! Everyone starts with a free 14-day trial of the Growth plan. After your trial, choose to purchase any plan that best suits your needs. This gives you a great starting point to explore the capabilities of Databox and see how it can help you streamline your data visualization and reporting needs.
What does the free 14-day trial include?
The free trial gives you 14 days of unlimited access to the Growth plan, which includes AI-enhanced analytics and performance management features designed for companies focused on growth.
With the Growth plan, you’ll have:
- Unlimited Users: Collaborate with your entire team without restrictions.
- Hourly Data Updates: Ensure your data is always current with hourly updates.
- Unlimited Databoards: Create as many dashboards as you need to monitor all aspects of your business.
- Unlimited Historical Data: Access and analyze historical data without limitations.
- Up to 1,000 Custom Metrics: Tailor your dashboards with custom metrics to meet your specific needs.
- Advanced Analysis and Reporting: Leverage advanced features for in-depth analysis and comprehensive reporting.
- Data & AI Powered Features: Utilize new AI-powered features to gain deeper insights from your data.
The free trial provides a comprehensive experience of Databox’s most powerful tools, allowing you to see firsthand how it can drive growth and optimize performance for your business.
What kind of data can I visualize with Databox?
With Databox, you can visualize data from over 100 different sources, including marketing, sales, CRM, financial, and operational data. This includes platforms like Google Analytics, Facebook Ads, HubSpot, and many more, ensuring comprehensive data coverage.
Do I need any technical skills to use Databox?
No, you don’t need any technical skills to use Databox. Our intuitive drag-and-drop builder and one-click templates make it easy for anyone to create and customize dashboards. Plus, we offer super support and an assisted setup service to help you get started and make the most of the platform.
How customizable are the dashboards?
Databox dashboards are highly customizable. You can tailor them to your specific needs by adding your own colors, logos, and background images. You can also white-label your dashboards when sharing them with clients, ensuring they match your brand perfectly.
How can Databox help improve decision-making?
Databox helps improve decision-making by providing real-time, data-driven insights. Our AI-powered summaries highlight key performance changes and offer ideas for improvement, while interactive features allow you to drill down into the data for a deeper understanding. This enables more informed and timely decisions.
Is Databox suitable for my business size/type?
Yes, Databox is suitable for businesses of all sizes and types. Whether you’re a small business owner, a marketer, or part of a larger enterprise, Databox can cater to your specific needs with its flexible and scalable solutions. We serve brands, marketing agencies, businesses and influencers of all sizes.
How secure is my data with Databox?
Your data is secure with Databox. We offer enhanced security features such as Force SSO, Two-Factor Authentication, and Advanced Password Protection to ensure your data is protected at all times.
Can I use Databox on mobile devices?
Yes, Databox is fully mobile-ready. You can access and view with your dashboards in our mobile app, ensuring you have critical data at your fingertips no matter where you are. Also our Databox web app is responsive and should work on most mobile devices with larger screens. But for the best experience, please use a desktop device.
What kind of support and resources are available?
Databox provides extensive support and resources, including customer support, tutorials, and an assisted setup service. Our super support team is always ready to help you get started and answer any questions you may have.
Are dashboards interactive?
Yes, dashboards in Databox are interactive. Here are a few ways you can engage with the data:
- Hovering over data points to view specific values.
- Adjusting date ranges for individual visualizations.
- Updating visualizations with a single click.
- Choosing which lines (metrics, trend, goals) to view on charts.
Can I create dashboards combining data from different sources?
Yes! In fact, we recommend doing this to get a comprehensive view of performance. Inside the dashboard builder, you can swap through different data sources you’ve connected and pull whatever metrics you need right into your dashboard.
Clear answers,
as fast as you have questions.
Compare
Databox Inc.
HQ: Boston, MA, USA
AI-powered analytics for teams that need answers now.
Databox Inc.
HQ: Boston, MA, USA

AI-powered analytics for teams that need answers now.


Compare