Uses one-click integrations:
-
 Google Analytics 4
If you don't use Google Analytics 4, you can pull data from any of our 130+ one-click, native integrations or from spreadsheets, databases and other APIs.
Try this dashboard for freeWhat you’ll learn from this Google Analytics 4 Monetization Overview Dashboard template:
By connecting your Google Analytics 4 account, you’ll learn:
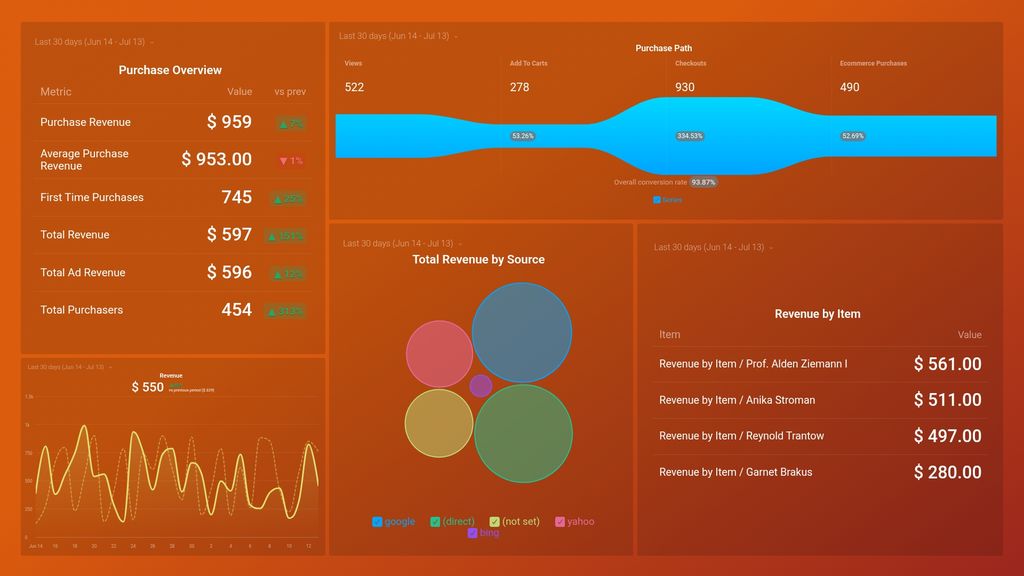
- How much are you generating in sales? See how much money you've generated in the current month in real-time. Analyze daily trends and all purchase events with Google Analytics 4 properties to ensure your website and app generate sufficient revenue to meet your sales goal.
- How many of your viewers actually convert? See the purchase path of your website visitors before becoming customers. This is a great way to assess if your website or app needs optimization. By having all of the steps laid out, you can immediately determine which part of your purchase path needs adapting.
- Which of your sources generates the most revenue? See how much revenue your business generates from each marketing source you're using. Ensure you collect data on everything, even the custom events, to learn which one is the most profitable.
- Which are your best-selling products? See your most popular items in terms of volume in the last 30 days. Based on the information you gather from this monetization report, you'll be able to determine if you need to add more products to your list or work on your revenue strategy.
What else can you track and visualize with our deep integration with Google Analytics 4?
When it comes to attributing to your traffic and conversions, almost anything:
- Traffic and lead demographics
- Sales revenue
- Mapping out the customer journey
- Calculate average revenue per user/ARPU
- Website and app engagement
- Purchase paths of your users
- Landing page performance
- Monitor audience growth over time.
There are many, many different metrics and metric combinations you can track using Google Analytics 4. And in Databox, you can quickly visualize 100s of Google Analytics metrics in a variety of different ways. Read more about Databox’s Google Analytics 4 integration.
Google Analytics 4 metrics included in this template
-
Average Purchase Revenue
Average Purchase Revenue is a metric in Google Analytics 4 that measures the average revenue generated per transaction. It helps businesses understand the value of each purchase and identify opportunities to increase revenue per customer.
- Total Purchasers
- First Time Purchasers
- Add To Carts
- Checkouts
-
Ecommerce Purchases
The Ecommerce Purchases metric measures the total number of completed purchases made on an ecommerce website, including the quantity of items purchased and revenue generated.
-
Item Revenue by Item name
Item Revenue by Item name is a metric that shows the total revenue earned by each individual item sold, allowing businesses to assess the popularity and profitability of different products. This information can be used to determine which items to promote, which to discontinue, and which to adjust prices for.
-
Purchase Revenue
Purchase Revenue is a metric that shows the total amount of revenue generated from online purchases made on a website or app.
-
Views
Views is a metric in Google Analytics 4 that tracks the number of times a particular page or screen is viewed by a user on your website or app.
-
Total Ad Revenue
Total Ad Revenue is a metric that measures the total income generated from all types of ads on a website or app. It includes revenue from clicks, impressions, affiliate marketing, and sponsored content.
-
Total Revenue
Total Revenue is a key performance indicator that measures the overall amount of money generated by sales of products or services over a specific period of time.
-
Total Revenue by Session Source
Total Revenue by Session Source shows the total revenue generated from a specific traffic source, such as organic search, paid search, or direct traffic, over a given time period.