Uses one-click integrations:
-
 Appfigures
If you don't use Appfigures, you can pull data from any of our 130+ one-click, native integrations or from spreadsheets, databases and other APIs.
Try this dashboard for free
Appfigures metrics included in this template
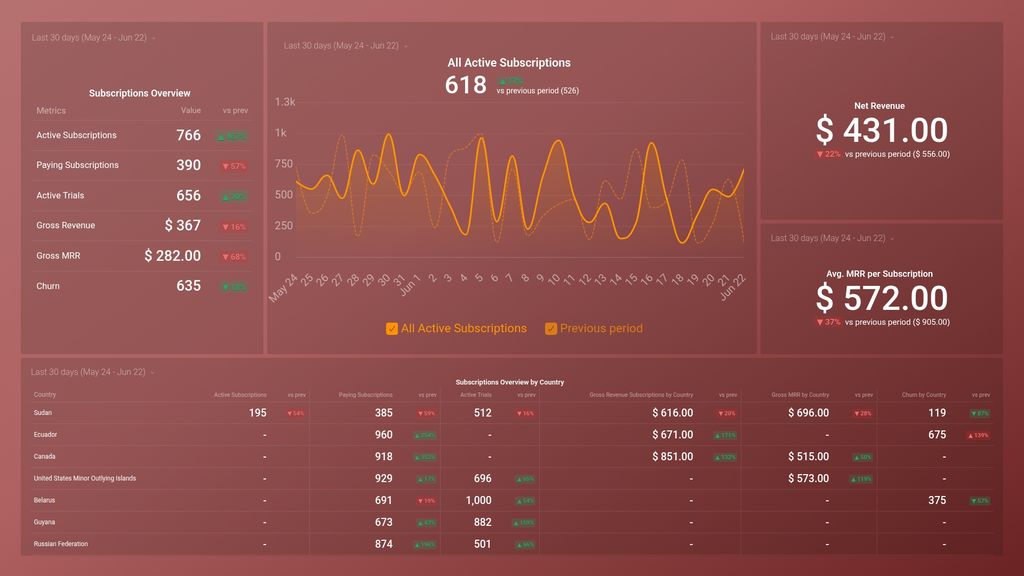
- Avg. MRR per Subscription
-
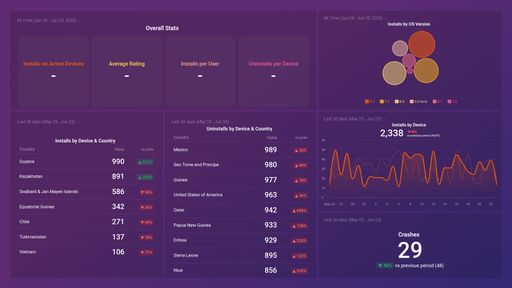
Active Subscriptions
Active Subscriptions is the number of paying users who have an active subscription to an app or service at a specific point in time.
-
Active Subscriptions by Country
This metric shows the total number of active subscriptions (recurring revenue) on a specific date, segmented by the country where the subscription was purchased.
-
Active Trials
Active Trials is a metric that shows the number of users who are currently using a trial version of your app or subscription.
-
Active Trials by Country
Active Trials by Country in AppFigures shows the number of active trial users per country for a specific app.
-
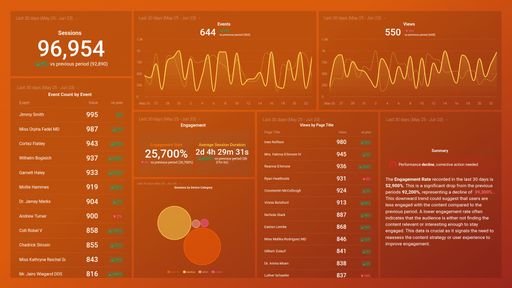
Net Revenue
Net Revenue is the amount of money earned from the sales of an app after refunds, app store fees, and other deductions have been subtracted.
-
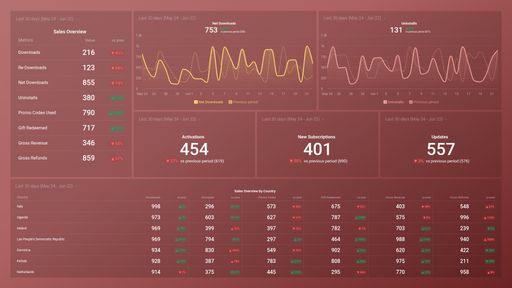
All Active Subscriptions
The All Active Subscriptions metric measures the total number of active subscriptions for an app or publisher across all platforms and subscription types.
-
Churn
Churn measures the rate at which users are leaving your app or service, indicating customer retention. It is calculated by dividing the number of users lost over a time period by the total number of users at the beginning of that period.
-
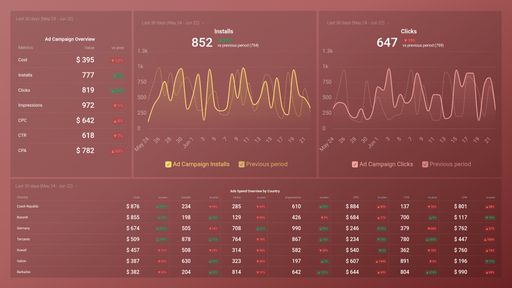
Churn by Country
Churn by Country measures the rate at which app users discontinue usage of an app in different countries, providing insights into user retention and potential reasons for lost users.
-
Gross MRR
Gross MRR is the total amount of monthly recurring revenue earned by an app or service before accounting for any discounts, refunds, or cancellations.
-
Gross MRR by Country
Gross MRR by Country measures the total monthly recurring revenue generated by an app in each country, before accounting for any expenses or deductions.
-
Gross Revenue Subscriptions
The Gross Revenue Subscriptions metric shows the total amount of revenue generated from subscriptions before any deductions or fees.
-
Gross Revenue Subscriptions by Country
The Gross Revenue by Country metric shows how much revenue an app is generating in each country where it is available, providing insights into its global performance.
-
Paying Subscriptions
The Paying Subscriptions metric tracks the number of active subscriptions that generate revenue for an app or service. It helps assess the overall health and profitability of a subscription-based business model.
-
Paying Subscriptions by Country
The Paying Subscriptions by Country metric displays the number of paying subscribers to an app broken down by their country of origin.