
Track all of your key business metrics from one screen
GET STARTED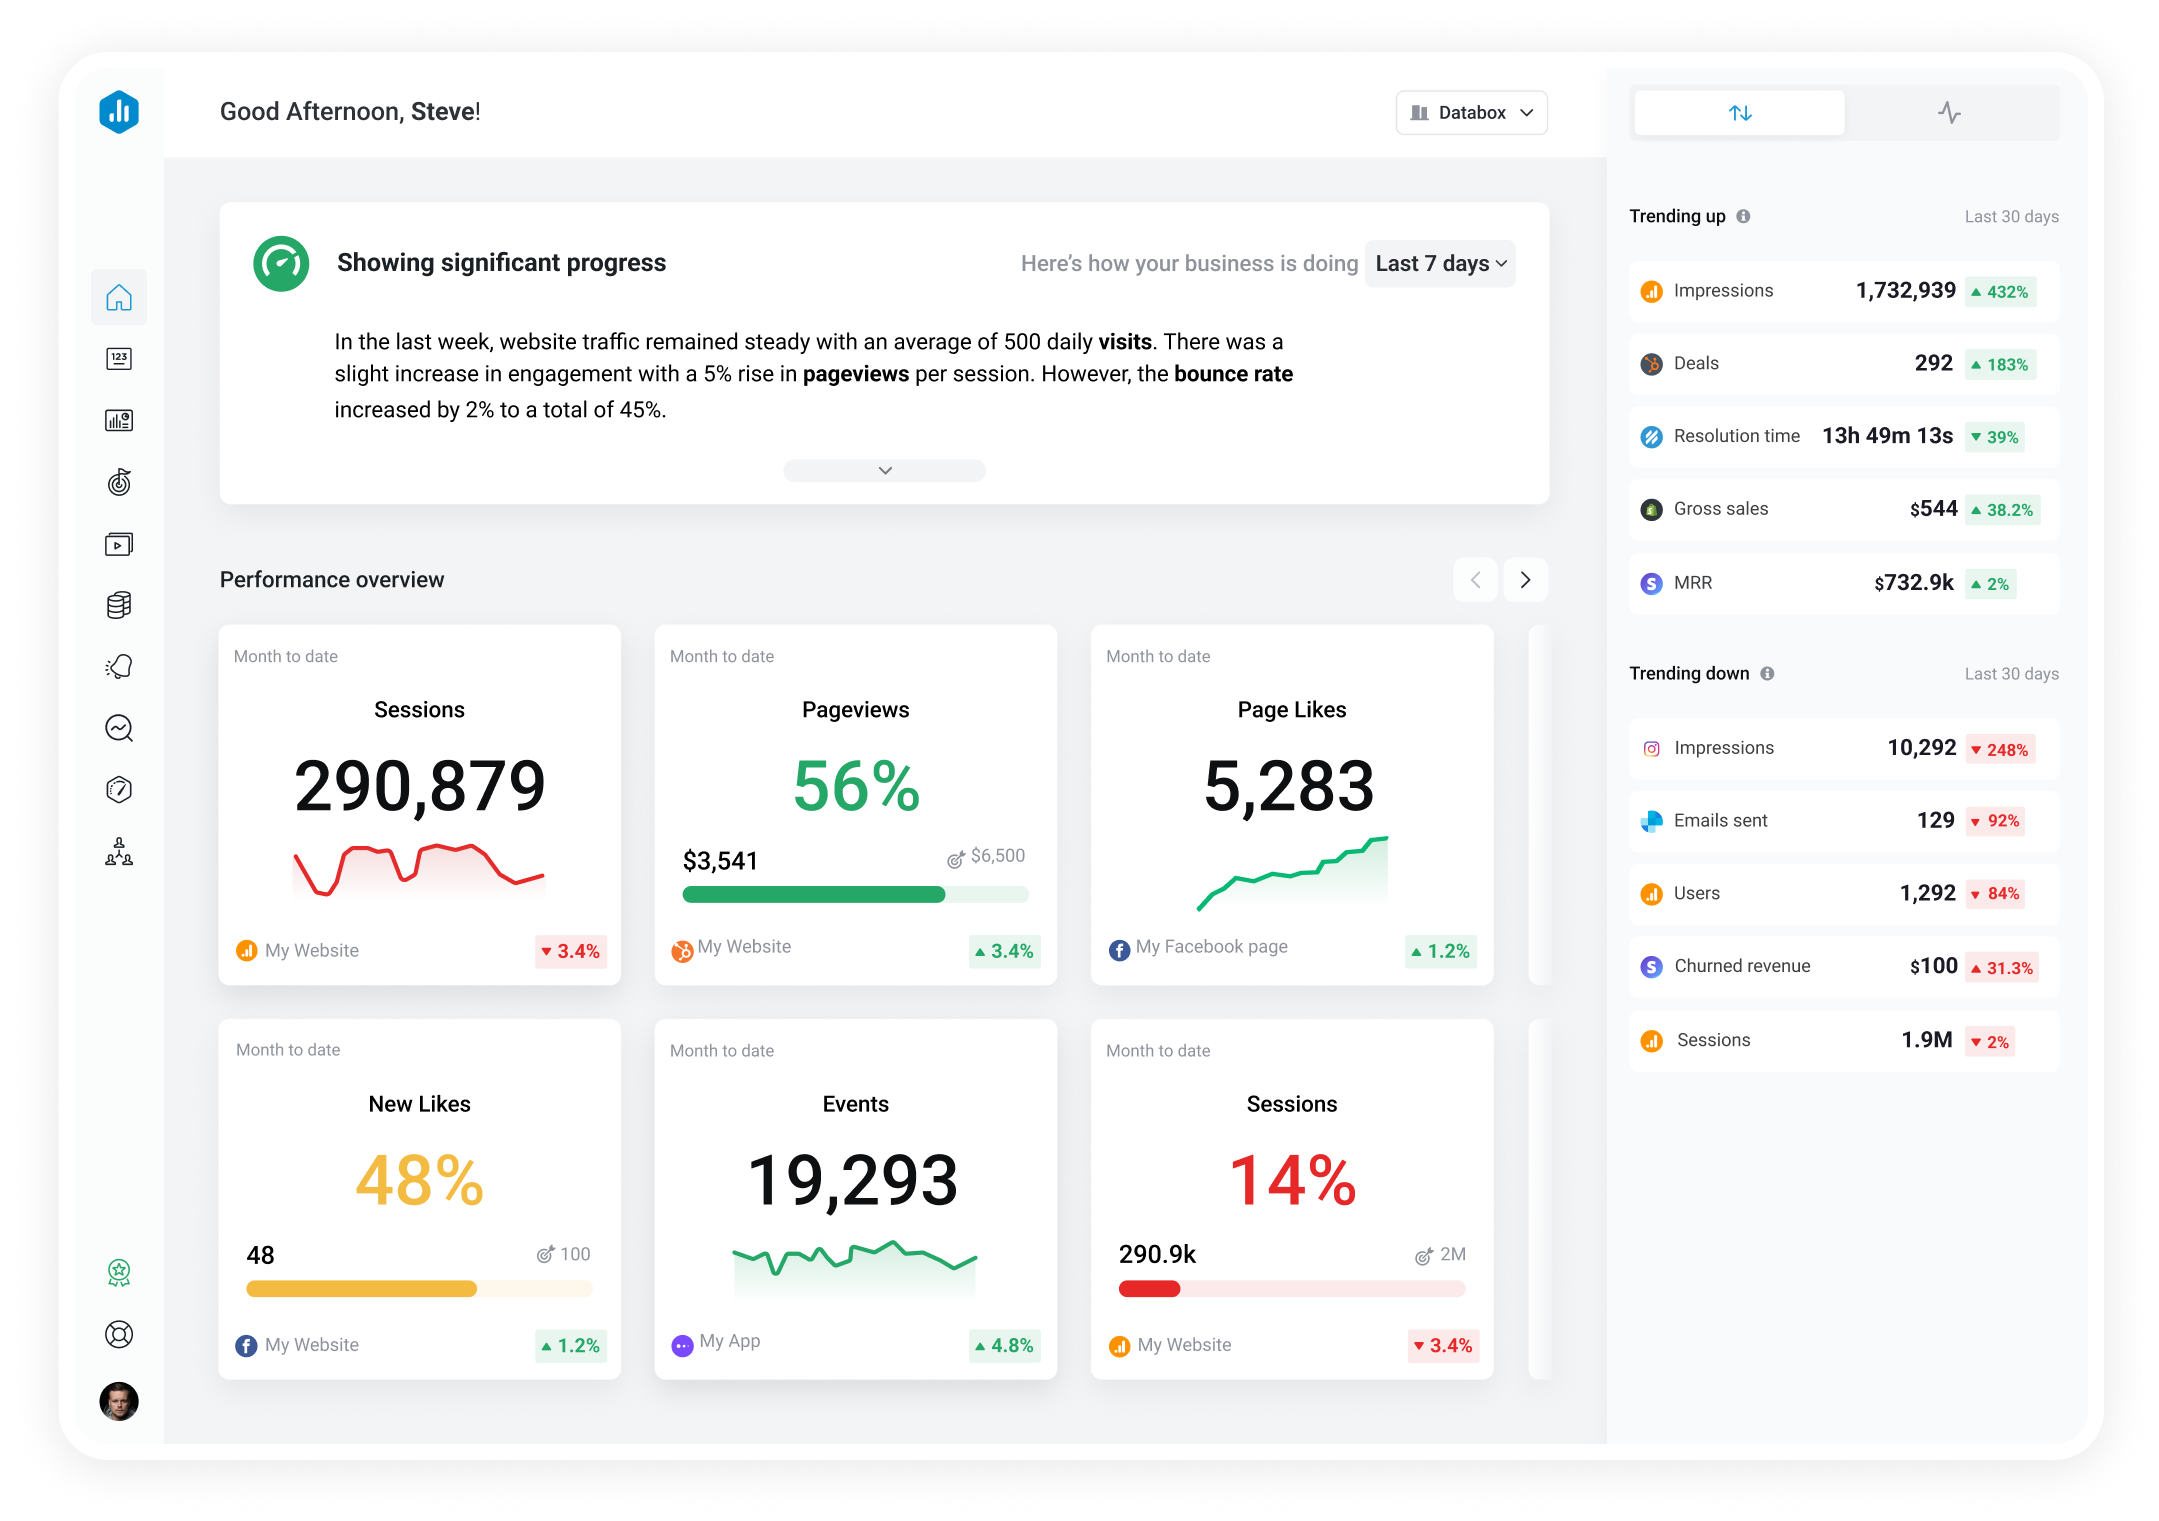

 SEMrush
Keywords in TOP 3
SEMrush
Keywords in TOP 3 Keywords in TOP 3 is a SEMrush metric that shows the number of keywords for which a domain or URL ranks in the top 3 search engine results pages. It indicates a site's visibility and potential traffic from high-ranking and relevant search queries.
With Databox you can track all your metrics from various data sources in one place.

Used to show a simple Metric or to draw attention to one key number.
Databox is a business analytics software that allows you to track and visualize your most important metrics from any data source in one centralized platform.
To track Keywords in TOP 3 using Databox, follow these steps:
 Goals
Goals Scorecards
 Metric Digest
 Metric Builder
 Data Calculations
 Performance Screen
This dashboard displays the change in your online presence based on your keyword rankings over time.
This template moves you through the Attract stage by showing your social media follows and reach, blog view performance, and overall visibility trends.


Semrush Keywords/Organic Search Traffic dashboard template combines SEMRush with Google Analytics 4 to see how your rankings translate to traffic.
Unlock the power of your SEO strategy with this SEO Performance report. Track vital metrics like keyword visibility, traffic growth, and site health effortlessly. Perfect for keeping stakeholders informed and your SEO efforts on target.

Use this Semrush report to share important SEO insights like position tracking, keyword rankings, site audit health, and more.
Google Analytics 4
The Transactions metric in Google Analytics 4 tracks the number of successful purchases made on your website or app and allows you to measure the monetary value of those transactions. It gives you insights into your conversion rates, revenue, and e-commerce performance.
Instagram Business
The Following metric on Instagram Business refers to the measure of people who have chosen to follow your account for updates on your brand. It provides a key insight into your brand's reach and allows you to gauge the effectiveness of your content strategy for building a loyal audience.
Instagram Business
The Followers / Following Rate is a metric that measures the ratio of a user's followers to the number of accounts they follow. It can indicate the level of engagement and influence a user has on the platform.
SEMrush
Relative Visibility is a SEMrush metric that measures a website's visibility compared to its competitors in the same market, based on organic search results and the keywords they rank for.
SEMrush
Estimated Traffic is a metric in SEMrush that shows the estimated monthly search traffic that a particular domain, subdomain, or URL receives from Google's organic search results.
SEMrush
The Average Position metric in SEMrush measures the typical rank of a website's organic search results for targeted keywords over a certain period.
SEMrush
The Keywords in TOP 10 metric shows the number of organic search keywords for which a domain or URL ranks in the top 10 search results on Google. This helps to assess the search engine visibility and ranking performance of a website.
SEMrush
Keywords in TOP 20 is a SEMrush metric that shows the number of keywords a website ranks for in the top 20 search engine results pages. It helps gauge a website's search visibility and SEO performance.
LinkedIn Company Pages
Followers metric on LinkedIn Company Pages shows the number of users who have chosen to receive updates from the company. It indicates the reach and engagement potential of the page.
 Salesforce CRM
The New Leads metric measures the number of potential customers that have been added to a company's database within a specific period of time. This metric is important for tracking the growth of a company's prospect pool and helps identify the effectiveness of their lead generation strategies.
Show all related metrics...