“Absolutely by far my favorite reason to log into Databox. I’ve looked for other companies that do the same, and no one does it as clean, and as simple, and as easy to set up as Databox.”

Marketing Max’s Favorite Data Reporting Tool
- All your marketing data in one place.
- Drag-and-drop dashboards.
- Easy to setup.
- Easier to use.
Over 20,000 Agencies and Businesses worldwide get their business performance analyzed with Databox.


Every Growth Hack Starts As Data
“Before selling my agency, I used one Databox account to manage all of my 25+ clients. From the time I started using it in 2018 to today, it’s further enforced my belief that every company needs to keeps tabs on their data, and specifically their marketing data, every single day.
Why?
You’ll start to notice trends. You’ll be able to fix things going wrong way sooner and way faster with a tool like Databox.
And more importantly… you’ll be able to get ahead of the trends.
Below I’ve listed all of my top Databox features because I believe they can not only help you become a better marketer, but also take action and bring true growth to your business (or your agency clients.)”

My Must-Use Features

KPI Scorecards
The Basics: Databox Scorecards send you updates on up to 15 KPIs directly to your phone, inbox, or Slack at your cadence of choice.
How I Use It: I created a master Facebook Ads Scorecard for my media buying team with a line for each of my top-spending client ad accounts. We knew what we needed to change, or look into, or optimize that day. It was like a morning to-do list for my entire team.
Track What Matters
Scorecards are hyper-focused on the KPIs that matter most to you and your clients.
Easy to Set Up
No one does it as clean, as simple, or as easy. Get your first Scorecard set up and delivered in minutes.
Take Action
Build a more efficient process with scheduled report sends and reminders.

Easy-to-Plug-In Data Sources
The Basics: Databox has 75+ one-click integrations that come loaded with thousands of metrics you can drag and drop into your dashboards or reports.
How I Use It: The UI makes it easy to plug in and monitor your data sources. For example, when I go to connect Google Analytics, it shows me everything I’m able to import so I can decide if that’s the right source to connect. Client leaving? Type in their name and you can disconnect their data in a few clicks.
My Must-Have Databox Integrations

Best-in-Class Templates
The Basics: Databox has over 200 pre-built templates. Just connect your data sources, and get instant visualizations of your key marketing metrics in minutes.
How I Use It: The templates has everything you need—they’re already built out. Plug in your Facebook account, and you’re done. Makes the time to stand up a client on the agency side, really easy.
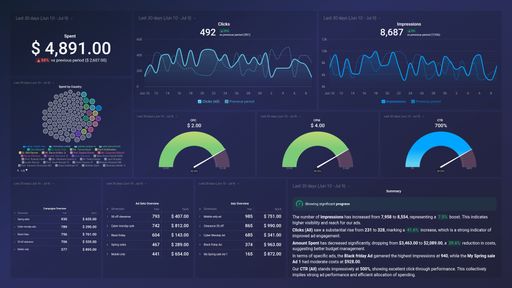
Facebook Ads dashboard template provides you with insights about ad engagement, click activity, money spent and more. You can discover which campaigns need improvement.
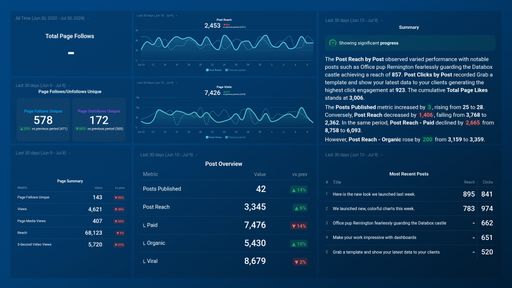
Facebook dashboard template provides you with insights about page views, likes post reach which will help you to know more about page followers.
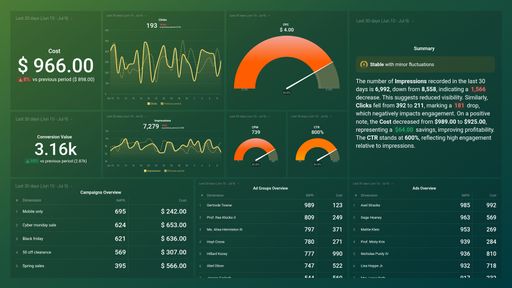
Analyze your campaigns, ad groups, keywords and engagement metrics to improve your return on investment (ROI).
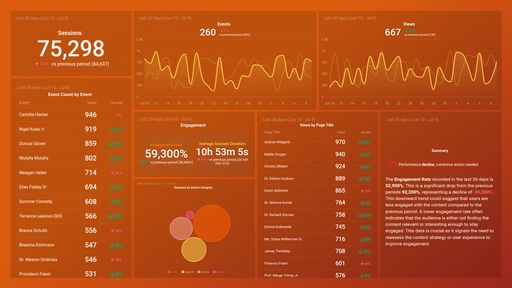
Download this dashboard to measure the overall engagement of your website and app visitors. Get insights into how visitors interact with your most important pages, which actions are they taking, how much of their time they’re giving you and more

VIP “Get You Set Up” Call
You may not have the time to build out the perfect dashboard or Scorecard… but the Databox team does. Marketing Max subscribers who sign up from this page will get a free “Get You Set Up” call to, well, get you set up.
- Get Dashboards Built FasterThe Databox team will set up your first dashboard for you in 24 hours and highlight the key functionality Databox customers use to analyze performance and discover actionable insights.
- A Little Extra GuidanceNot sure which metrics matter most to your business? The Databox team has helped thousands of businesses build a better reporting process. They’ll help you determine the right KPIs based on your goals and build a dashboard that visualizes these metrics in a way that’s accessible and actionable.


4.5 out of 5 stars
read reviews

2021 Leader on the
G2 Grid for Data Visualization

4.8 out of 5 stars
read reviews
What else can Databox do?
A lot of magic happens when you connect all of your performance data in one place—you can also set and measure progress toward goals, create custom metrics, share and automate reports with your team, get notifications when certain metrics are on or off track, and much more.

Set Goals & Track Your Progress
- Visualize future goals against current performance
- Get alerted if something dramatically dips
- Get notified when hitting your goal looks likely
- Make performance more predictable

Build custom dashboards
- Visualize data from spreadsheets and 75+ marketing tools and platforms
- Drag-and-drop interface for easy building. Robust templates for immediate set up.
- No code or design skills necessary
- Pull from our library of thousands of pre-built metrics, or build formulas to create your own

Automate your reporting process
- Move beyond the “screenshot report” by pulling in dashboards and metric charts
- Build professional deck-like reports in minutes
- Schedule sends and reminders on your preferred cadence
- Data Stories provide dynamically generated text to your report
Ready to get started?
Connect your data and start visualizing your marketing performance in minutes.
Sign up


GDPR
compliant
compliant
certified