Uses one-click integrations:
-
 Freshdesk
If you don't use Freshdesk, you can pull data from any of our 130+ one-click, native integrations or from spreadsheets, databases and other APIs.
Try this dashboard for free
Freshdesk metrics included in this template
-
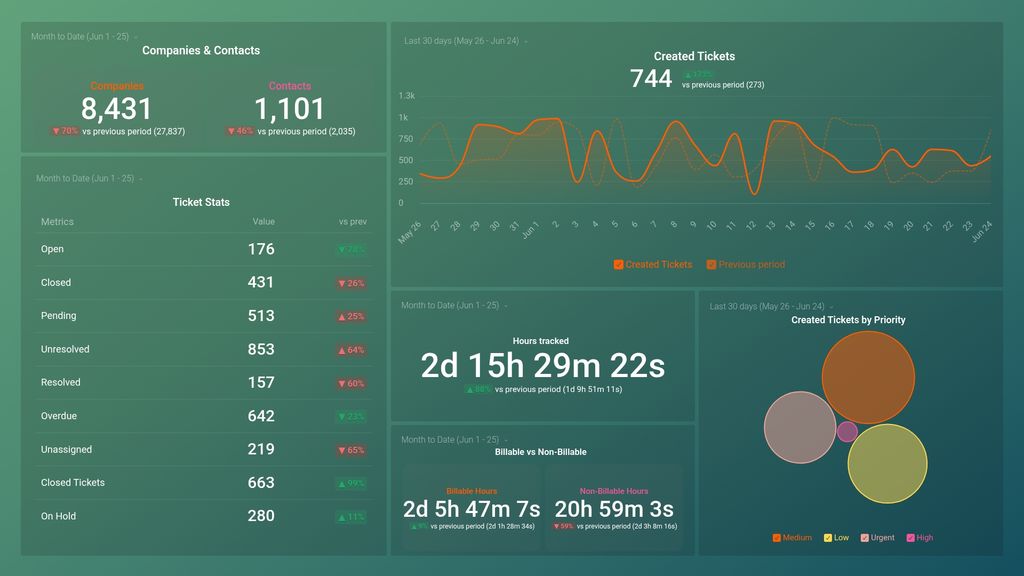
Billable Hours
Billable Hours is a measure of the amount of time spent by an agent working on customer issues that can be charged to the customer. It helps assess the productivity and profitability of the support team while ensuring accurate billing and revenue recognition.
-
Closed Tickets
The Closed Tickets metric refers to the total number of support tickets that have been resolved and marked as closed within a specific time period in Freshdesk.
-
Companies
The Companies metric in Freshdesk is a count of the total number of unique companies (organizations) that have been created and interacted with in the helpdesk, including tickets, contacts, and other activities.
-
Contacts
Contacts metric in Freshdesk tracks the number of unique individuals who have contacted your support team through various channels like email, phone, chat, or social media. It helps to measure the volume of customer interactions and improve support processes.
-
Created Tickets
The Created Tickets metric in Freshdesk measures the total number of new support requests submitted by customers over a certain period of time.
-
Created Tickets by Priority
The Created Tickets by Priority metric displays the total number of support tickets created in Freshdesk based on their priority levels (low, medium, high, urgent).
-
Hours Tracked
The Hours Tracked metric in Freshdesk measures the time spent by agents on each ticket, providing insights into productivity, customer satisfaction, and performance evaluation.
-
Non-Billable Hours
Non-billable hours metric is a measure of the time spent by employees on non-billable activities such as training, meetings, admin work, etc. It helps organizations track productivity and efficiency.
-
On Hold Tickets
On Hold Tickets metric represents the number of tickets that have been put on hold by agents or customers and are awaiting further action or information.
-
Open Tickets
The Open Tickets metric refers to the number of customer support tickets that have not yet been resolved or closed by the support team.
-
Overdue Tickets
The Overdue Tickets metric measures the number of tickets that have surpassed their due date and have not been resolved or closed.
-
Pending Tickets
The Pending Tickets metric represents the number of support tickets that are awaiting action or response from agents or customers. It is a key indicator of workload and efficiency in customer support operations.
-
Resolved Tickets
Resolved Tickets is a measure of the total number of support tickets that have been successfully resolved and closed within a defined period of time.
-
Unassigned Tickets
The Unassigned Tickets metric shows the number of tickets that have not yet been assigned to an agent or group.
-
Unresolved Tickets
Unresolved Tickets metric represents the number of support queries that are yet to be resolved by the customer support team in Freshdesk.