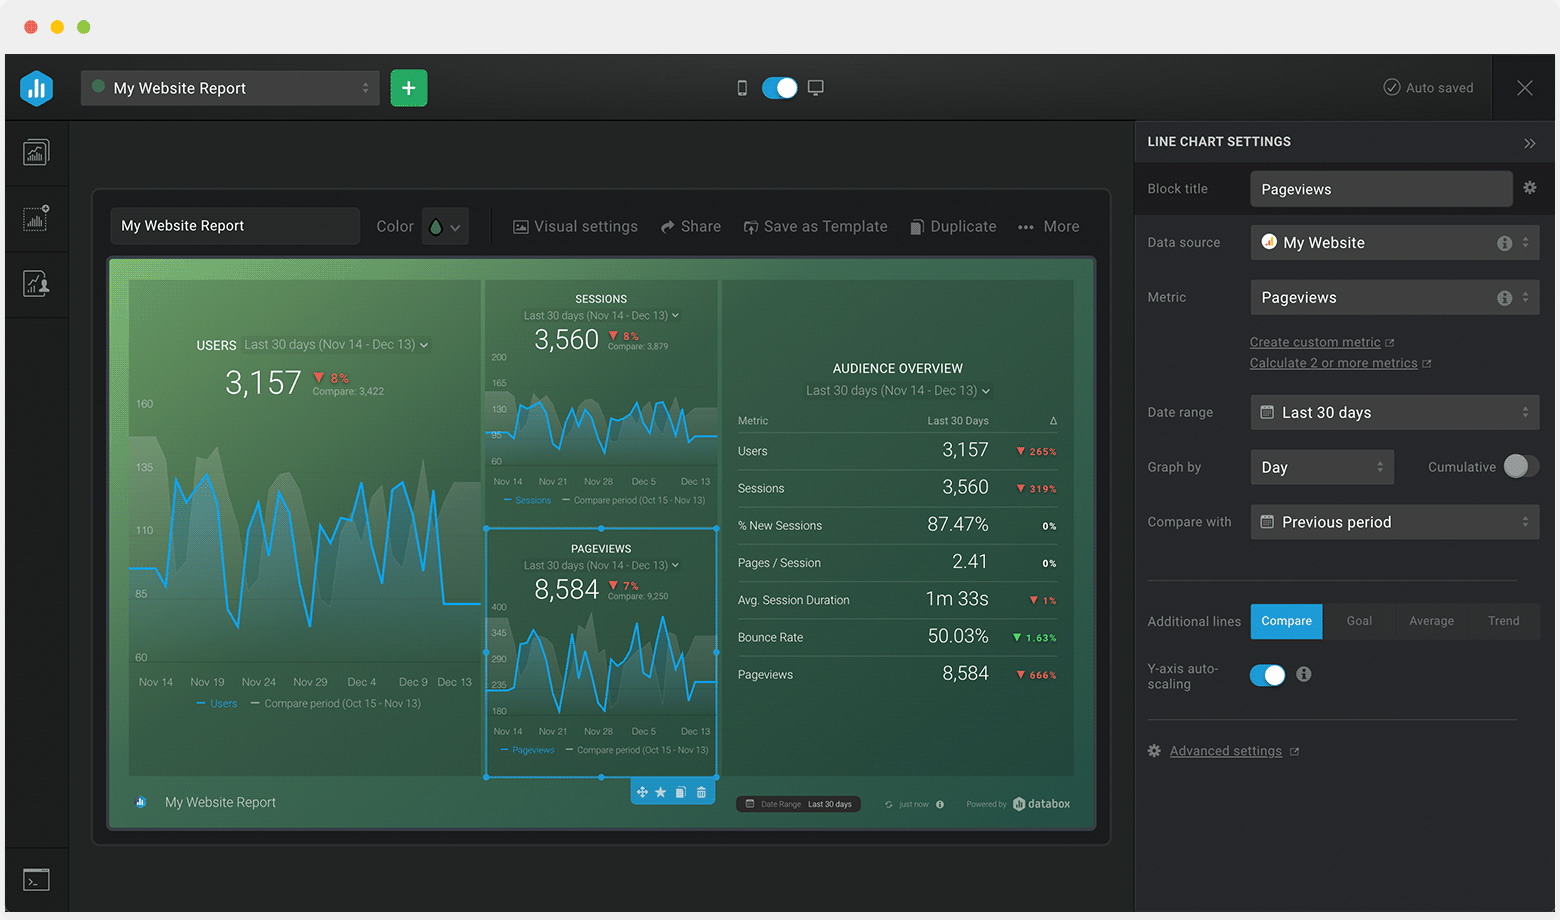
Track some of the most common Store Overview metrics and KPIs and analyze your Store Overview performance with just a few clicks.
You can build a dashboard with any data using Zapier, Make, Google Sheets, or a SQL database.

All store performance dashboard templates come pre-built with some of the most commonly tracked metrics from the most popular tools. You can customize your templates at any time.
Try It Free


No design or coding skills necessary.
Learn more about Dashboard DesignerAn online store overview dashboard displays all the key metrics that are required to get a comprehensive overview of your online store and typically includes data related to total sales, popular products, and new customers.
With the help of a store performance dashboard, marketing and ecommerce experts are able to get actionable data on all online store transactions, conversions, generated revenue, average order value, and much more.
A comprehensive store performance dashboard should include data about your sales, products, and customers. Additionally, a retail dashboard should show historical data regarding monthly sales, shopping cart abandonment rates, most popular products, new and returning customers sales, average order value, and similar in order for others to see how things are trending over time.
A carefully crafted ecommerce dashboard should help inform your strategy by answering how many orders your store has on a daily basis, how profitable is your store in general, how many new and repeat customers you have and more.
