Uses one-click integrations:
-
 HubSpot Marketing
-
 Facebook Pages
-
 Instagram Business
-
 LinkedIn Company Pages
-
 X (Twitter)
If you don't use HubSpot Marketing, Facebook Pages, Instagram Business, LinkedIn Company Pages or X (Twitter), you can pull data from any of our 130+ one-click, native integrations or from spreadsheets, databases and other APIs.
Try this dashboard for freeWhat you’ll learn from this Social Media (Awareness & Engagement) Dashboard template
Use this social media dashboard template to gain insights into all activities carried out across your favorite social networks. Ramp up your social media marketing efforts by tracking and measuring:
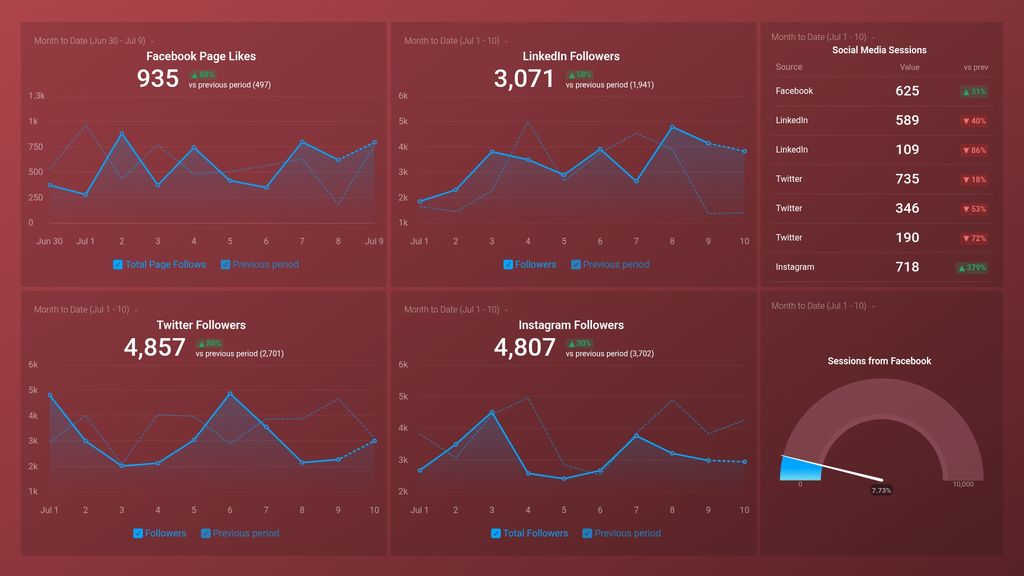
- How many likes does my Facebook page have? See the total number of likes your Facebook page has acquired over time. Visually monitor and compare the number of Facebook page likes gained in a month to that of the previous month, especially if you’re keen on brand awareness.
- How do I track follower growth on my social media channels? View the number of followers you have on any of your favorite social media channels (LinkedIn, Twitter, and Instagram) at any given time. Track your daily follower growth and compare this data to the same time the previous month.
- Which social channels drive the most traffic to my website? Find out which social media channels drive the most traffic to your website. See the total number of sessions each social media channel generates on a monthly basis, and use this information to focus your marketing efforts on the channel that produces the best quality traffic.
- How many sessions does Facebook generate? Track the number of sessions your Facebook account generates monthly against your set goal for the month. Is it worth committing some more time and resources to this channel based on your observation?
Pull additional data using our deep integration with Facebook Ads
What other campaign metrics can you track and visualize with our integration with Facebook Ads? Almost anything:
- Individual campaign and ad performance
- Clicks, downloads, leads, and sales
- Cost per impression (CPM), click (CPC), and lead (CPL)
- Return on ad spend (ROAS)
- Ad spend and overall budget
- Landing page performance
- Progress towards your campaign goals, and more
In Databox, there are almost 100 Facebook Ads metrics already built and ready for you to visualize in a variety of different ways. With Query Builder and Data Calculations, the range of different metrics and metric combinations you can track from Facebook Ads widens.
Read more about Databox’s Facebook Ads integration.
Explore more X (Twitter) dashboards.
What else can you track and visualize with our deep integration with HubSpot Marketing?
When it comes to traffic and conversions, almost anything:
- Website traffic and conversions
- Traffic and lead demographics
- Landing page performance
- The conversion rate(s) throughout your marketing and sales funnel(s)
- Track and compare the efficiency of your marketing campaigns
- Monitor campaign improvements and growth over time
There are many, many different metrics and metric combinations you can track using HubSpot Marketing. And in Databox, you can quickly visualize 100s of HubSpot metrics in a variety of different ways, alongside all the important metrics from other data sources you’re using.
Read more about Databox's HubSpot Marketing integration.
What other campaign metrics can you track and visualize with our integration with Linkedin company pages? Almost anything:
- LinkedIn ad performance
- Impressions, engagement, clicks, comments, and shares
- Follower demographics
- Pageviews and Unique views
- Track and compare the efficiency of your marketing campaigns
- Progress towards your campaign goals, and more
In Databox, there are dozens of LinkedIn metrics already built and ready for you to visualize in a variety of different ways. With Query Builder and Data Calculations, the range of different metrics and metric combinations you can track from LinkedIn company pages.
Read more about Databox's LinkedIn Company Pages integration.
What other campaign metrics can you track and visualize with our integration with Twitter? Almost anything:
- Twitter engagement rate
- Return On Investment
- Follower demographics
- Tweet performance
- Hashtag performance
- Follower demographics
In Databox, there are dozens of Twitter metrics already built and ready for you to visualize in a variety of different ways. With Data Calculations, the range of different metrics and metric combinations you can track from Twitter company pages.
Read more about Databox's Twitter Company Pages integration.
What else can you track and visualize with our deep integration with Instagram business?
When it comes to traffic and conversions, almost anything
- Impressions and reach
- Account performance
- Follower growth and count
- Website and email clicks
- Profile visits
In Databox, there are dozens of Instagram metrics already built and ready for you to visualize in a variety of different ways. With Data Calculations, the range of different metrics and metric combinations you can track from Instagram company pages.
Read more about Databox's Instagram business integration.
Facebook Pages metrics included in this template
- Total Page Follows
LinkedIn Company Pages metrics included in this template
-
Followers
Followers metric on LinkedIn Company Pages shows the number of users who have chosen to receive updates from the company. It indicates the reach and engagement potential of the page.