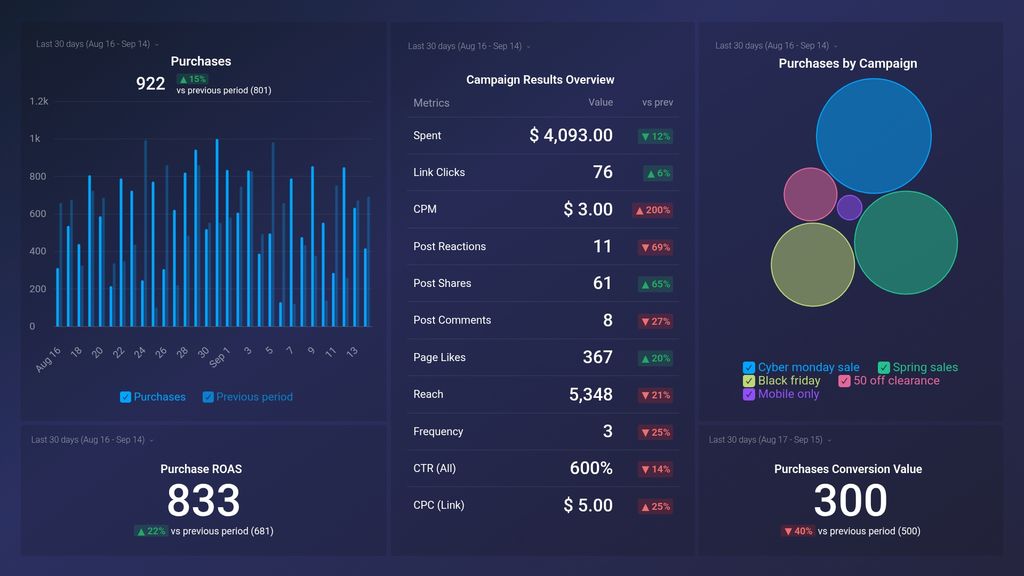
What you’ll learn from this Facebook Ad Campaign for eCommerce Dashboard Template
Simply connect your Facebook Ads account, and you’ll learn:
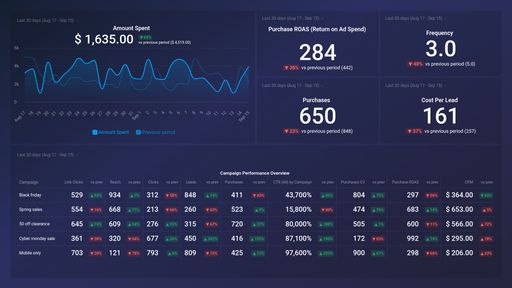
- How do I track my purchases on Facebook ads? See which specific campaigns resulted in users purchasing a product or products from your online store within a specific time frame. View the total number of completed purchases made on your eCommerce site as a result of your Facebook ad campaign daily, weekly, monthly, or within a specified date range.
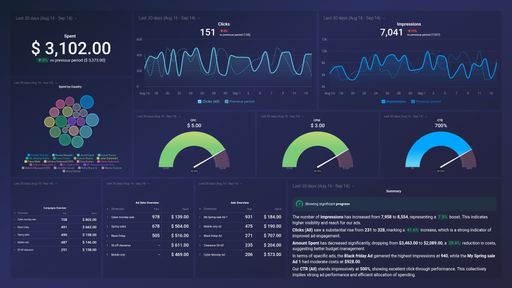
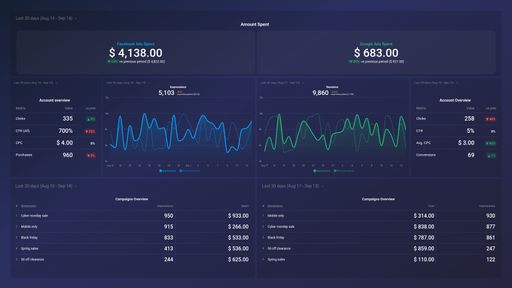
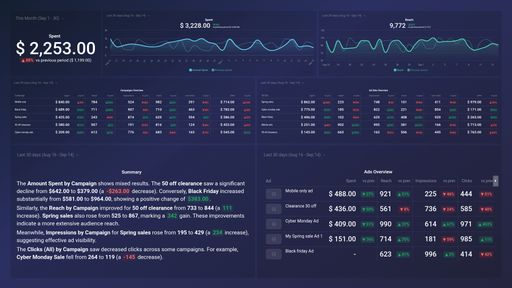
- How do I measure my Facebook ad campaign performance? Measure and analyze your ad campaign’s results by tracking and (improving) important metrics, such are: total number of completed purchases, budget spent, link clicks, CPM, post engagement (reactions, shares, comments, likes), reach, frequency, and so on.
- What is the total return on ad spend (ROAS) generated from website purchases? Measure the effectiveness of your ad campaign in generating revenue for your eCommerce business. See how much in revenue your eCommerce business gets back for each dollar spent on advertising. Tracking this data allows you to evaluate the performance of your active ad campaigns as well as the correlation between advertising spend/efforts and generated revenue.
Pull additional data using our extensive integration with Facebook Ads.
What other campaign metrics can you track and visualize with our integration with Facebook Ads? Almost anything:
- Individual campaign and ad performance
- Clicks, downloads, leads, and sales
- Cost per impression (CPM), click (CPC), and lead (CPL)
- Return on ad spend (ROAS)
- Ad spend and overall budget
- Progress towards your campaign goals, and more
In Databox, there are almost 100 Facebook Ads metrics already built and ready for you to visualize in a variety of different ways. With Query Builder and Data Calculations, the range of different metrics and metric combinations you can track from Facebook Ads widens.
Read more about Databox’s Facebook Ads integration.