Uses one-click integrations:
-
 Help Scout Mailbox
If you don't use Help Scout Mailbox, you can pull data from any of our 130+ one-click, native integrations or from spreadsheets, databases and other APIs.
Try this dashboard for freeWhat you’ll learn from this HelpScout for Customer Support Dashboard Template:
Monitor and assess your customer service team’s performance in terms of speed and quality at any given point in time. Connect your Help Scout account and learn:
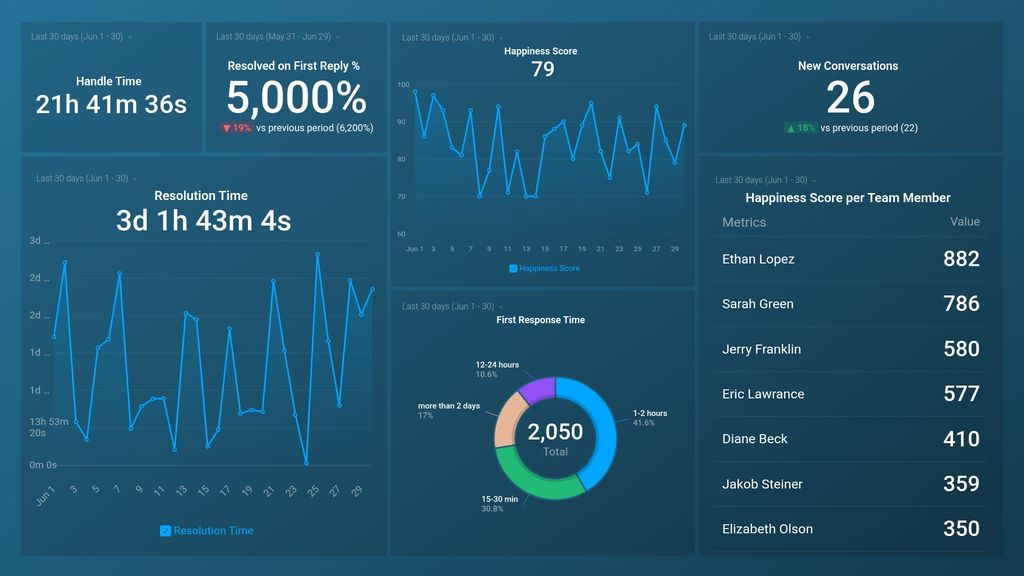
- How long do customers have to wait to get a response? View the number of minutes, hours, or days it takes for your customer agents to first respond to a customer inquiry or support ticket. It is worth the effort to keep your first response time as low as possible, as this metric plays a crucial role in determining how satisfied your customers are or will be. Stay focused on the marketing channels that are actually driving results and make adjustments to the ones that are underperforming.
- How long does it take on average for customer issues, tickets, or cases to be resolved? Keep an eye on the average amount of time it takes your customer support team to resolve all open tickets or issues daily. If your resolution time is high, it is important to find out why and what to do to fix the attributed bottlenecks, i.e., are your agents overburdened with work? Lacking knowledge in certain areas?
- How do I measure and manage customer happiness? Track your customer satisfaction and experience ratings. That is, find out how happy your customers are on average with the support they received within a specified time period. Also, see and compare side-by-side the aggregate happiness score given to each customer support team member.
- What is the average length of a customer's call? Measure your customer team’s efficiency based on the average amount of time it takes them to handle a call or transaction from the time the customer initiates the call until the end, and this also includes hold time and transfers.
- What percentage of customer conversations got resolved on the first reply? Measure the percentage of conversations that were resolved on the first reply within the specified time period. This metric is a great measure of your team’s efficiency and how complex the tickets being handled might be.
Pull additional data using our deep integration with Help Scout.
What else can you track and visualize with our deep integration with Help Scout? When it comes to delivering an excellent customer experience, pretty much anything:
- Cases by topic, cases by location
- Average handle time
- Resolved cases
- Customer satisfaction score
- Time to first response time
- Interactions per resolution
There are numerous metrics and metric combinations you can track using Help Scout. And in Databox, you can quickly visualize dozens of customer service metrics in various ways.
Read more about Databox’s Help Scout integration.
Explore more Help Scout dashboards.
Help Scout Mailbox metrics included in this template
-
First Response Time by Time Range
First Response Time by Time Range measures the average time taken by an agent to respond to the first message of a customer based on different time periods such as hours, days, or weeks.
-
Handle Time
Handle Time measures the time taken by an agent to resolve a customer query. It includes all the interactions and tasks performed during the ticket resolution process.
-
Happiness Score
The Happiness Score is a metric used by Helpscout that measures customer satisfaction based on the ratings given in customer feedback surveys.
-
Happiness Score by Team Member
The Happiness Score by Team Member metric measures the satisfaction level of customers after interacting with a specific customer support team member. It helps to identify the best-performing team members and areas for improvement in customer support.
-
New Conversations
New Conversations metric shows the number of new email or chat conversations started with your customers during a given time period in Helpscout.
-
Resolution Time
The Resolution Time metric measures how long it takes to fully resolve a customer issue from the time it was reported to when it was successfully resolved.
-
Resolved on First Reply (%)
The Resolved on First Reply (%) metric calculates the percentage of tickets that are resolved by the support team on the first customer reply.