What you’ll learn from this Google Analytics 4 E-commerce Overview
By connecting your Google Analytics 4 account, you’ll learn:
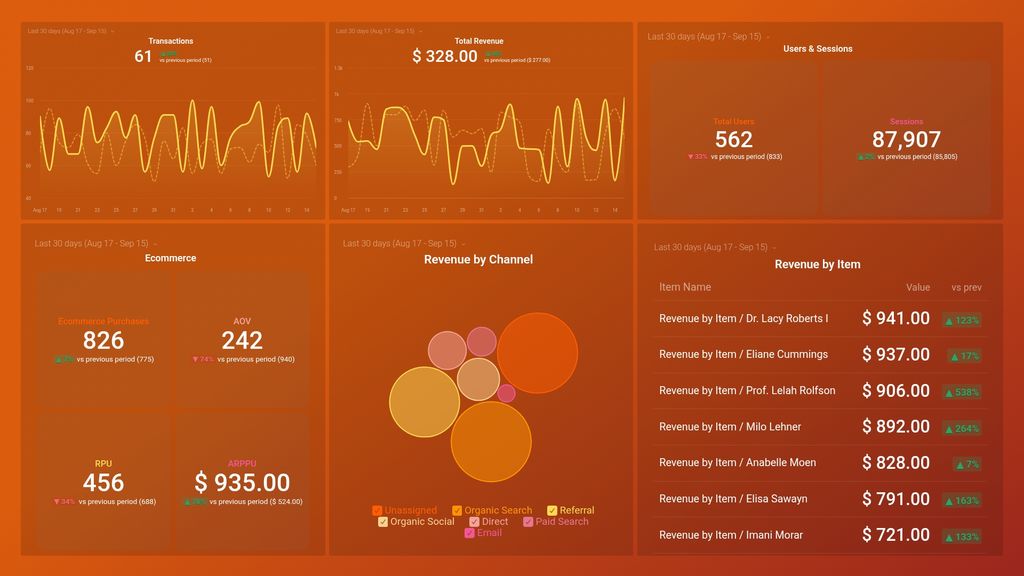
- Which items in your store bring in the most revenue? By tracking revenue by item, you can see what your customers are most interested in. And which items are worth stocking up on and which you can afford to remove from your store. Of course, this can change often due to various factors, but being able to keep track in real-time will ensure you always have what your customers need.
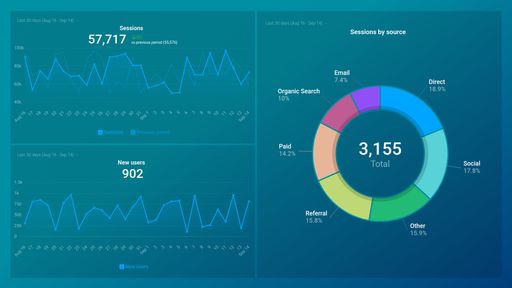
- Which channels bring in the most revenue? Identify the specific channels that bring in the most revenue for your e-commerce store. This will help you focus your efforts where you are most likely to see a ROI. Whether it is upping your paid ads budget or investing more in your email marketing campaigns.
- How is your e-commerce store doing in real time? By glancing at metrics like Average Order Value, Revenue per User, and Average Revenue per Paying User, you can see the overall shape of your store. Are these numbers close to your goals, or are they trending down? Based on these insights, you can make decisions that will help improve your revenue in real time.
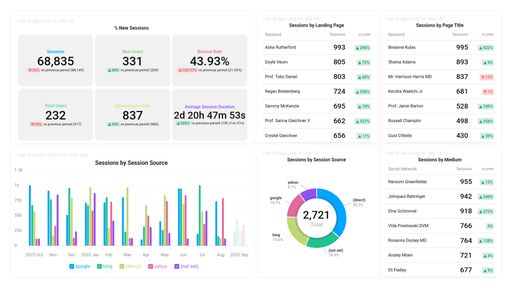
- How many people visit your ecommerce store? By tracking metrics like users and sessions, you can gain insights into the popularity of your store and if there is a continual increase in interest from users.
What else can you track and visualize with our deep integration with Google Analytics 4?
When it comes to attributing to your traffic and conversions, almost anything:
- Website Engagement
- Sales revenue
- Mapping out the customer journey
- Calculate average revenue per user/ARPU
- Website and app engagement
- Purchase paths of your users
- Landing page performance
- Monitor audience growth over time.
There are many, many different metrics and metric combinations you can track using Google Analytics 4. And in Databox, you can quickly visualize 100s of Google Analytics metrics in a variety of different ways. Read more about Databox’s Google Analytics 4 integration.