Uses one-click integrations:
-
 Vimeo OTT
If you don't use Vimeo OTT, you can pull data from any of our 130+ one-click, native integrations or from spreadsheets, databases and other APIs.
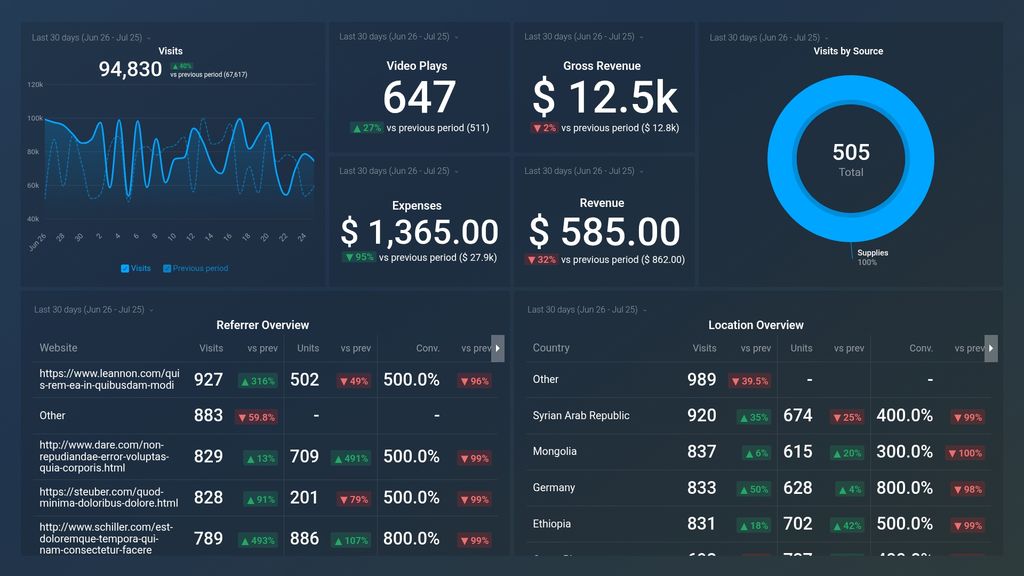
Try this dashboard for freeWhat you can learn from this Vimeo OTT Traffic Overview Dashboard Template
Connect your Vimeo OTT account and you’ll learn:
- How cost-effective are our videos? See what percentage of your conversions and revenue can be attributed to all of your promotional campaigns. Measure how cost-effective your campaigns are and assess your return on investment (ROI).
- How many visitors convert? Track your conversions rate and see how many units you’ve sold based on where your visitors came from. See if you’re reaching your target audience and if there's an opportunity to expand your audience from another source, country, or even platform.
- Which channels are driving the most traffic to my videos? See which channels are generating the most traffic to your Vimeo OTT account. Use this information to adjust your campaigns and targeting to improve your performance.
- Which platforms do our visitors use most? Find out which platforms your visitors use and the number of visitors each platform generates. For example, if there’s a huge difference in the amount of traffic iOS users generate compared to Android, you can dig deeper to find out why and make necessary adjustments to help expand your viewership.
- Are we staying within our budget? Quickly track expenses and revenue. Compare the numbers to previous periods and ensure your investment in video is paying off over the long term.
Pull additional data using our integration with Vimeo OTT
What else can you track and visualize with our integration with Vimeo OTT? When it comes to evaluating the success of your videos, almost anything:
- Viewer interaction and behavior
- Traffic demographics
- Video completion rate
- Subscribers growth
- Trial conversions
- Churn and cancelation
- Revenue, and more
In Databox, there are many Vimeo OTT metrics already built and ready for you to visualize in various ways. Track your Vimeo OTT KPIs alongside metrics from 70+ other integrations and track all of your performance metrics in one place.
Read more about Databox’s Vimeo OTT integration.
Vimeo OTT metrics included in this template
-
Revenue by Country
Revenue by Country is a metric that measures the total amount of money generated by VimeoOTT in each country where it operates. It gives insights on which countries are the most profitable for the company.
-
Revenue by Referrer
The Revenue by Referrer metric measures the amount of revenue generated from each traffic source that brings viewers to a VimeoOTT channel. This helps content creators understand which platforms or websites are driving the most revenue and adjust their marketing efforts accordingly.
-
Conversion Rate by Country
The Conversion Rate by Country metric measures the percentage of visitors to a VimeoOTT platform who become paying customers or complete a desired action, broken down by country. It helps identify which countries are most valuable in terms of revenue generation and audience engagement.
-
Conversion Rate by Referrer
The Conversion Rate by Referrer metric measures the percentage of website visitors from different referral sources who complete a desired action, such as making a purchase or filling out a form.
-
Expenses
Expenses metric records the costs incurred by a business to generate revenue. It includes expenses on ads, salaries, hardware, software, and other operating expenses. It helps to evaluate profitability and optimize spending.
-
Gross Revenue
Gross Revenue is the total amount of revenue generated by a business before deducting any expenses or taxes. It includes all sales, income, and other sources of revenue from the company's operations.
-
Units by Country
The Units by Country metric measures the number of video units purchased by viewers in a particular country on VimeoOTT. It helps to analyze the popularity of content in different regions.
-
Units by Referrer
Units by Referrer is a metric that measures the number of units sold on a VimeoOTT channel based on where the traffic came from. It helps identify the most effective referral sources for driving sales and optimizing marketing strategies.
-
Visits by Source
Visits by Source metric shows the number of visits to a VimeoOTT channel or video, categorized by the source of the traffic such as direct, organic search, social media, email, referral or paid search.
-
Visits by Country
The Visits by Country metric provides information about the geographic locations of viewers who have visited a VimeoOTT channel or video page over a certain period of time.
-
Visits by Referrer
Visits by Referrer metric measures the number of times viewers land on your VimeoOTT page through a referring website, such as social media or search engines. It helps in understanding which sources are driving traffic to your content.
-
Revenue
Revenue is the total amount of income generated by VimeoOTT through the sale of its online video content or services to its customers. It is an important metric that reflects the financial health and growth potential of the business.
-
Video Plays
The Video Plays metric shows the total number of times a video has been played, including replays. It's a fundamental metric to measure user engagement and popularity of a video.
-
Visits
The Visits metric in VimeoOTT measures the total number of times a viewer has visited a video or channel page. It helps understand viewer behavior and engagement.