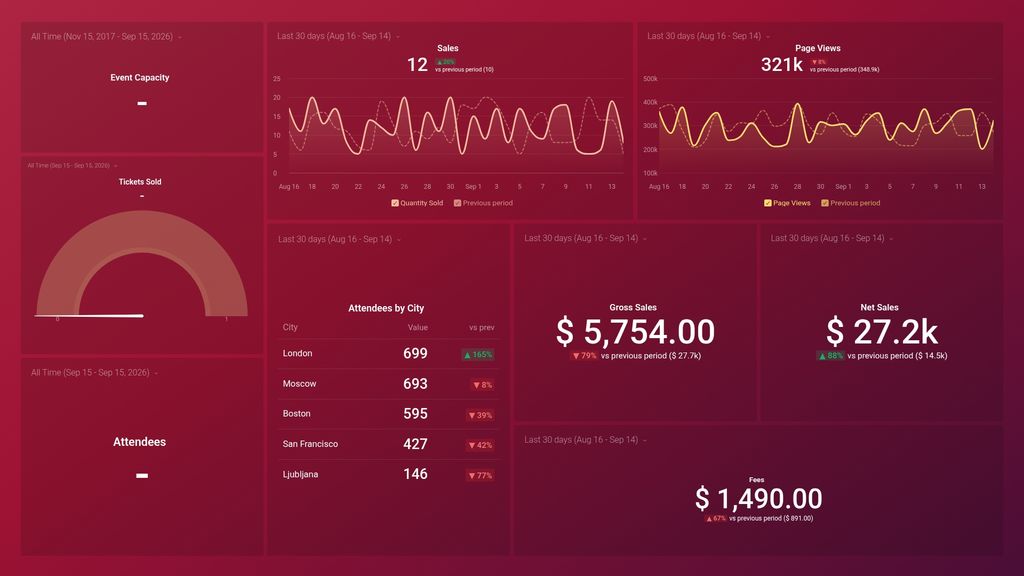
What you’ll learn from this Eventbrite (Event Marketing Analytics) Dashboard Template:
This dashboard template provides you with real-time insight into the performance of your event marketing campaigns. Track key metrics that impact your ticket sales, number of attendees, traffic flow, commitment to sponsors, and so on, to make smarter decisions with your event marketing budget. By connecting your Eventbrite account, you’ll learn:
- How do we track all sales generated for our event? See how many times your event page has been viewed. See how users interact with your even page on a daily basis and compare view counts for the current month to previous periods.
- Are we driving enough traffic to our event on Eventbrite? See how many times your event page has been viewed. See how users interact with your even page on a daily basis and compare view counts for the current month to previous periods.
- How many tickets have we sold thus far for our upcoming event? Track ticket sales for your event in real-time. Monitor progress towards your event tickets goal, this lets you know if you need to intensify your marketing efforts of halt ticket sales.
- How do we keep track of our event’s finances?Track and manage your event’s most important financial information. View the amount charged by Eventbrite for service and processing fees, as well as your profit before and after taxes and fees have been deducted.
- Where are our event attendees located? See which cities majority of your attendees come from and how many registered attendees are actually located in these cities. Use this information to optimize your promotions and target more people from that area or other cities.
- How do we find out the job roles of our survey respondents? Find out what all respondents to your event survey do for a living and what percentage of your respondents have these job titles, this is useful if your event is specifically targeted towards specific audiences.
Pull additional data using our deep integration with Eventbrite.
What other event marketing metrics can you track and visualize with our integration with Eventbrite? Almost anything:
- Attendance rate
- Total Revenue
- Ticket and coupon performance
- Sales by ticket type
- Top events by sales
- Cancellations and refunds
In Databox there are dozens of event marketing metrics already built and ready for you to visualize in a variety of different ways. With the use of Query Builder and Data Calculations, the range of different metrics and metric combinations you can track from Eventbrite widens.
Read more about Eventbrite integration.
Explore more Eventbrite dashboards.