Uses one-click integrations:
-
 Facebook Ads
If you don't use Facebook Ads, you can pull data from any of our 130+ one-click, native integrations or from spreadsheets, databases and other APIs.
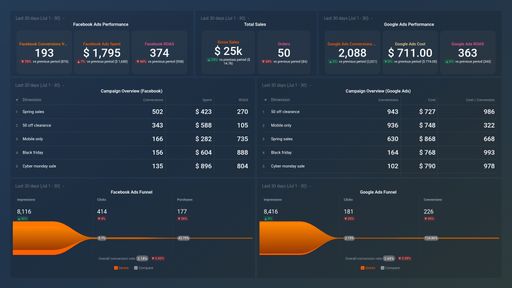
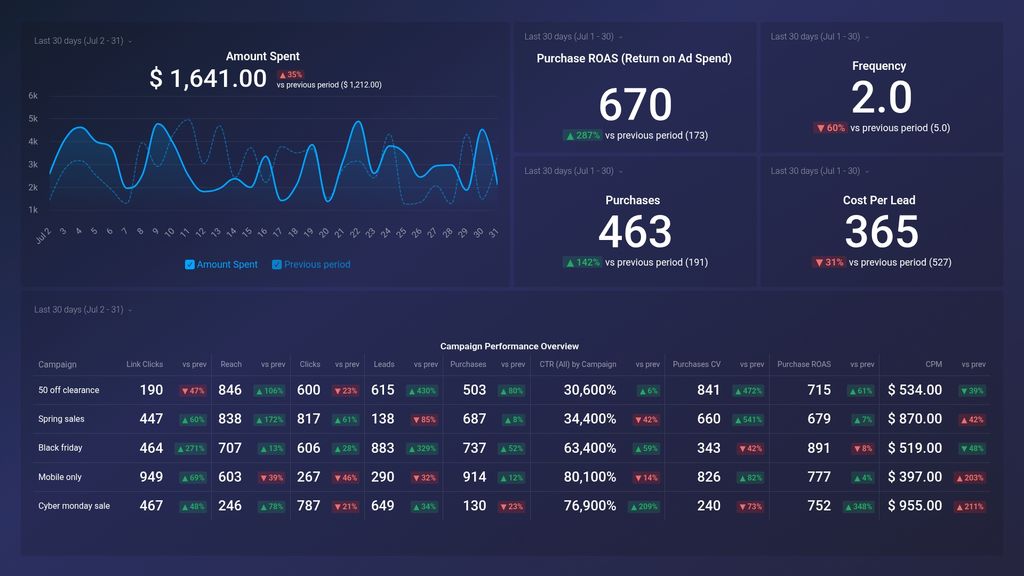
Try this dashboard for freeWhat you’ll learn from this Facebook Ads Purchase & Leads Breakdown Dashboard template
With this dashboard template, you’ll be able to accurately measure the performance and cost-efficiency of your Facebook Ad campaigns. No more guessing as to which campaigns are driving the results and which require adjustments. By connecting your Facebook Ads account, you’ll learn:
- What’s our current Facebook ad spend? See the total amount spent on ad campaigns in any given time period. Are you current over budget? Is your ad spend growing every month? Are your results scaling along with your spend?
- How many people have purchased from our ad campaigns? Track the total number of purchases attributed to your ad campaigns in any given time period. Compare to previous periods to track growth and set goals to measure your progress against.
- What’s our return on ad spend (ROAS)? Track the total return on ad spend (ROAS) from your advertising efforts. Are you earning more revenue (purchases) for each dollar you spend on advertising? Track your progress over time and make adjustments when they matter most.
- Are we generating impressions, clicks, and leads cost effectively? Track your overall cost per thousand impressions (CPM), cost per click (CPC), and cost per lead (CPL) in order to spot areas of concern and/or opportunities for optimization. You can always improve the efficiency of your ad spend––the first step is by having the data accessible in one place.
- How often are people seeing our ads in their news feed? Track the number of times your ad has been seen by a unique user on average over a given time period. This is a great way to ensure your audience doesn’t suffer from ad fatigue which can lead to a higher acquisition cost while also ensuring your ad is being seen enough times in order to hit your goals.
- Which campaigns generate the most leads and purchases?Track your top ad campaigns by the number of leads generated and the number of purchases. This way, you can reinvest ad spend from low performing campaigns into the ones that are proving to drive a higher return.
Pull additional data using our extensive integration with Facebook Ads.
What other campaign metrics can you track and visualize with our integration with Facebook Ads? Almost anything:
- Individual campaign and ad performance
- Clicks, downloads, leads, and sales
- Cost per impression (CPM), click (CPC), and lead (CPL)
- Return on ad spend (ROAS)
- Ad spend and overall budget
- Landing page performance
- Progress towards your campaign goals, and more
In Databox there are almost 100 Facebook Ads metrics already built and ready for you to visualize in a variety of different ways. With the use of Query Builder and Data Calculations, the range of different metrics and metric combinations you can track from Facebook Ads widens.
Read more about Databox’s Facebook Ads integration.
Facebook Ads metrics included in this template
-
Clicks (All) by Campaign
Clicks (All) by Campaign is a metric that measures the total number of clicks received by all ads within a specific campaign, including all clicks on links, call-to-action buttons, and other interactions with the ad.
-
CPM by Campaign
CPM by Campaign is the cost per thousand impressions of an advertising campaign on Facebook. It measures how much the advertiser pays to have their ad shown 1,000 times to the target audience, and can be used to compare the effectiveness of different campaigns.
-
CTR (All) by Campaign
The CTR (All) by Campaign metric is a measure of the number of clicks an ad receives divided by the number of times it has been served, across all campaigns. It helps to identify the effectiveness of ad campaigns and aids in optimizing them for better performance.
-
Leads by Campaign
The Leads by Campaign metric measures the number of leads generated by each Facebook ad campaign, helping businesses track the effectiveness of their ad campaigns in terms of lead generation.
-
Link Clicks by Campaign
Link Clicks by Campaign is a metric that measures the number of clicks on links within an ad, broken down by each individual campaign. It helps track the effectiveness of campaigns in driving traffic to a desired website or landing page.
-
Purchases Conversion Value by Campaign
The Purchases Conversion Value by Campaign metric measures the total value of purchases made by users who clicked on an ad within a specific campaign. It helps evaluate the return on investment (ROI) of a campaign and determine the effectiveness of different ads.
-
Purchases by Campaign
Purchases by Campaign is a metric that shows the number of times people purchased after clicking or viewing an ad in a specific campaign. It helps measure the effectiveness of the campaign in generating sales and determining its ROI.
-
Reach by Campaign
The Reach by Campaign metric measures the number of unique people who have seen an ad in a particular campaign during a set time period.
-
Amount Spent
The Amount Spent metric in Facebook Ads represents the total cost of all clicks, impressions, and other ad interactions that generated charges for your campaign or ad set.
-
Purchase ROAS (Return on Ad Spend) by Campaign
Purchase ROAS by Campaign is a metric that measures the effectiveness of a Facebook Ads campaign in driving sales revenue. It is calculated by dividing the total revenue generated from purchases by the cost of the advertising campaign.
- Cost Per Lead