ORIGINAL RESEARCH REPORT
Using AI You Don’t Trust: How Business Users Actually Run Analytics in 2026
Business users have made generative AI the analytical workspace. They use it daily for the highest-stakes work they produce. They explicitly say they don’t fully trust the answers. They keep using it anyway. We surveyed more than 100 business users to find out what’s underneath that contradiction, and what it’s already producing.

The Bill Has Come Due
The decisions have already been made on wrong AI numbers.
The heaviest users are the most burned. They are also the most likely to believe AI will replace their BI tool. 86% of daily users agree gen AI could replace their analytics platform. 80% of them have no unified data layer underneath the AI they’re betting that replacement on. This is the buyer of the next round of AI-analytics products. They are heavily invested, heavily exposed, and they know it.
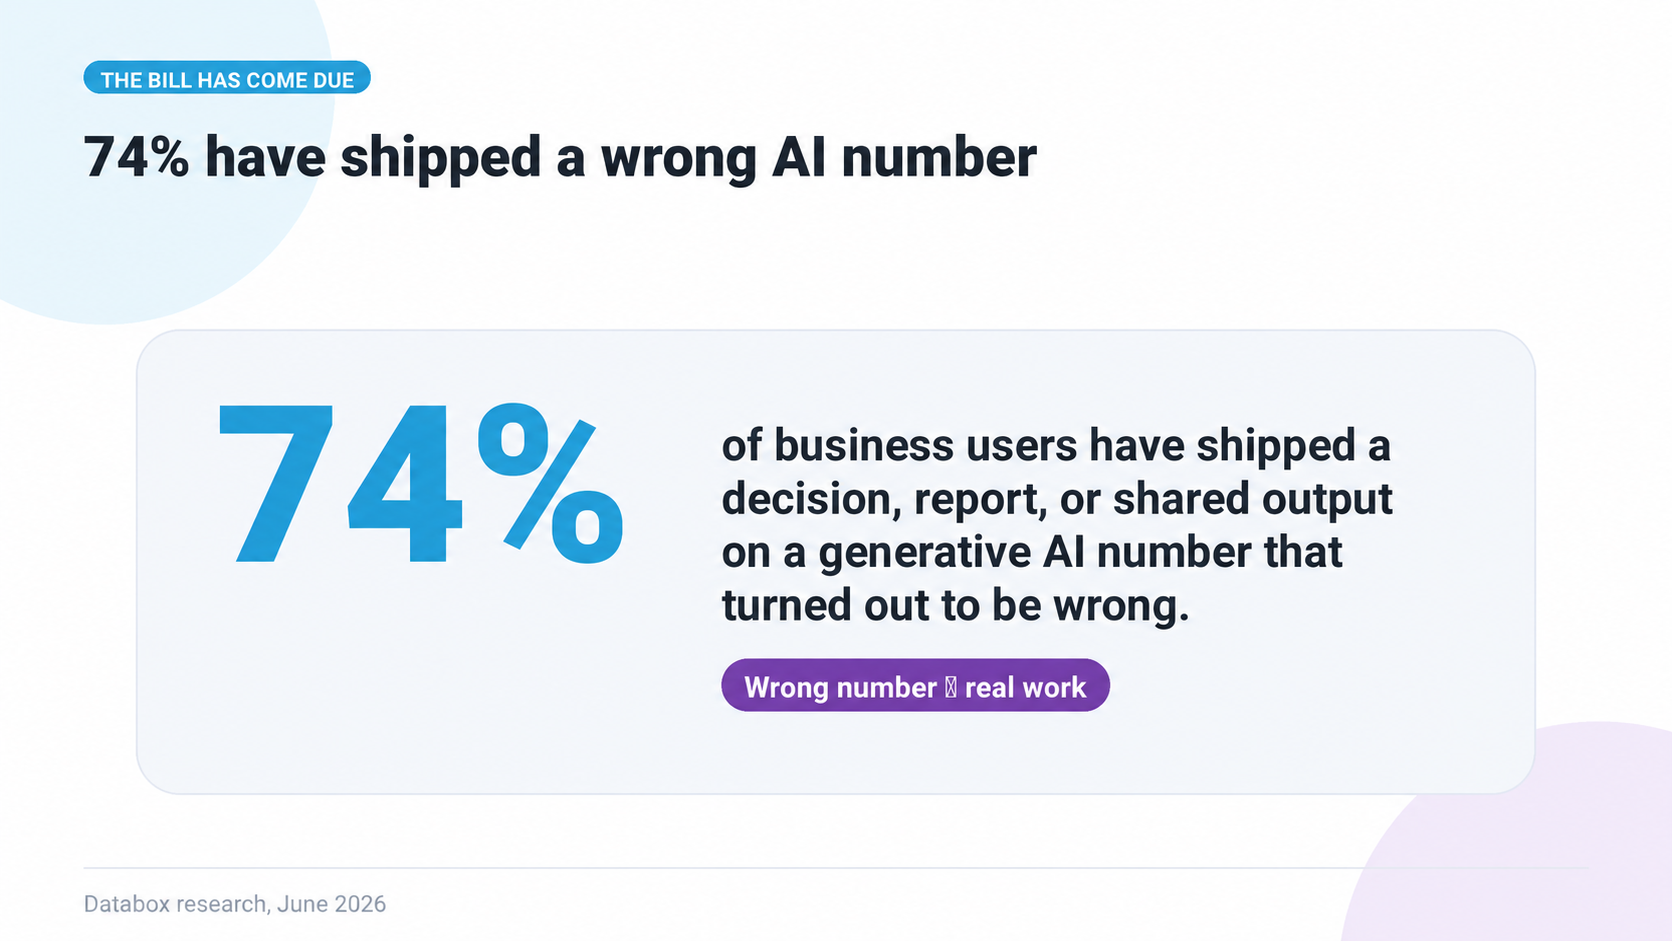
74% of business users have shipped a decision, report, or shared output based on a generative AI number that turned out to be wrong.
39% have done it in the last 30 days alone.
Among the 44 daily gen AI users in the sample, the lifetime rate is 91%. The 30-day rate is 66%.
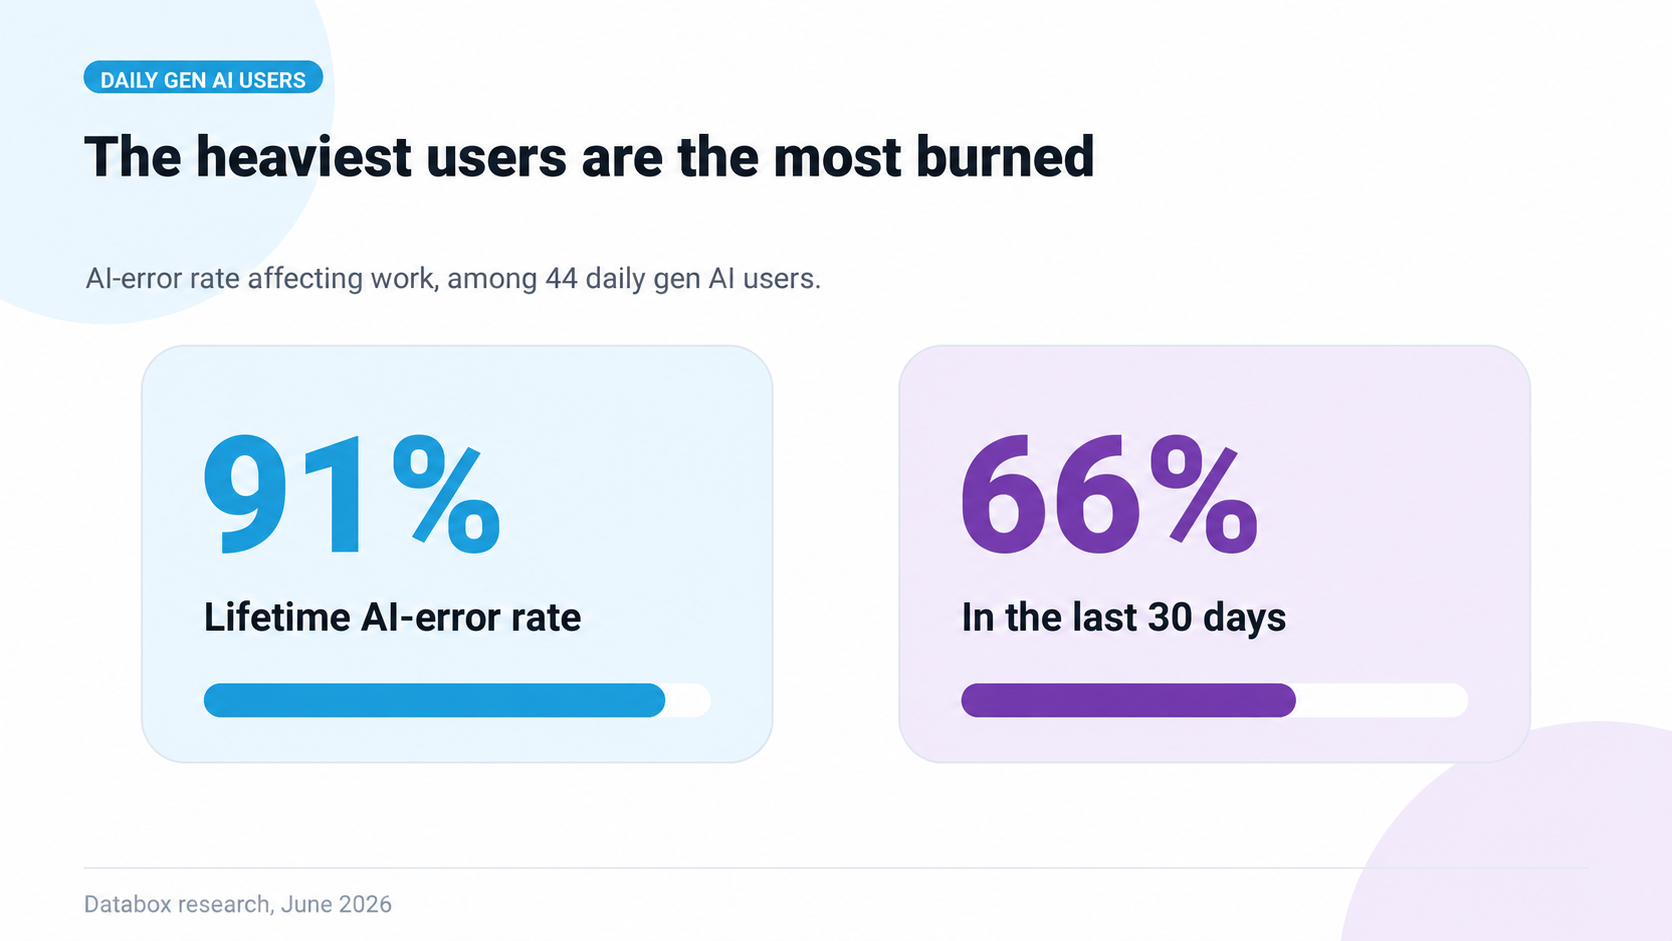
The 44 daily gen AI users in the sample have a 91% lifetime AI-error rate affecting work. 66% in the last 30 days. They are the most invested users in the category, and the most exposed.
These users are not unaware. They have been burned and they have not stopped. They have changed which AI tool they use, started “verifying every time,” added a workflow step. What 80% of them haven’t done is built a data layer their AI can read.
Using Despite Distrust
Use is high. Trust is not. Use happens anyway.
86% of business users reach for ChatGPT, Claude, Gemini, or Copilot before any other tool for analytical work. 47% pick ChatGPT as their primary. 15% Gemini, 13% Copilot, 4% Claude. Only 3% use a BI tool’s built-in AI as their primary. 66% reach for gen AI for analytical work several times a week or more often.
Across the twelve analytical tasks the survey tested, business users report a 19 to 41 percentage-point gap between how often they use gen AI for a task and how much they trust it for that same task. The widest gaps are on the highest-stakes work.
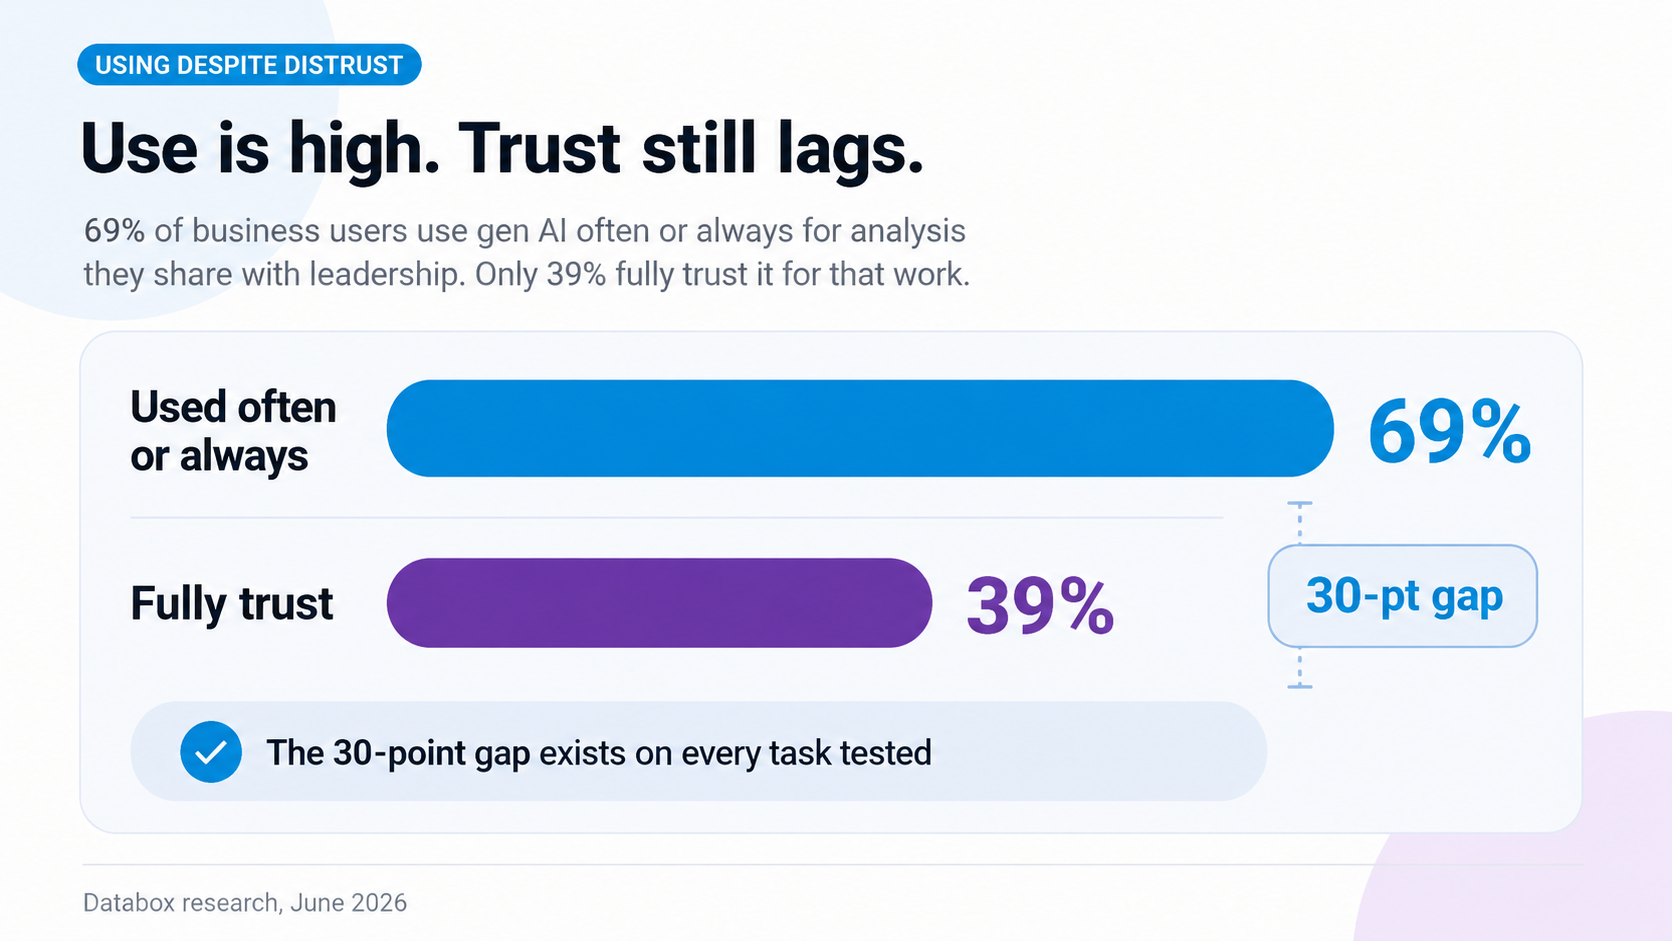
69% of business users use gen AI often or always for analysis they share with leadership. 39% fully trust it for that work. The 30-point gap exists on every task tested.
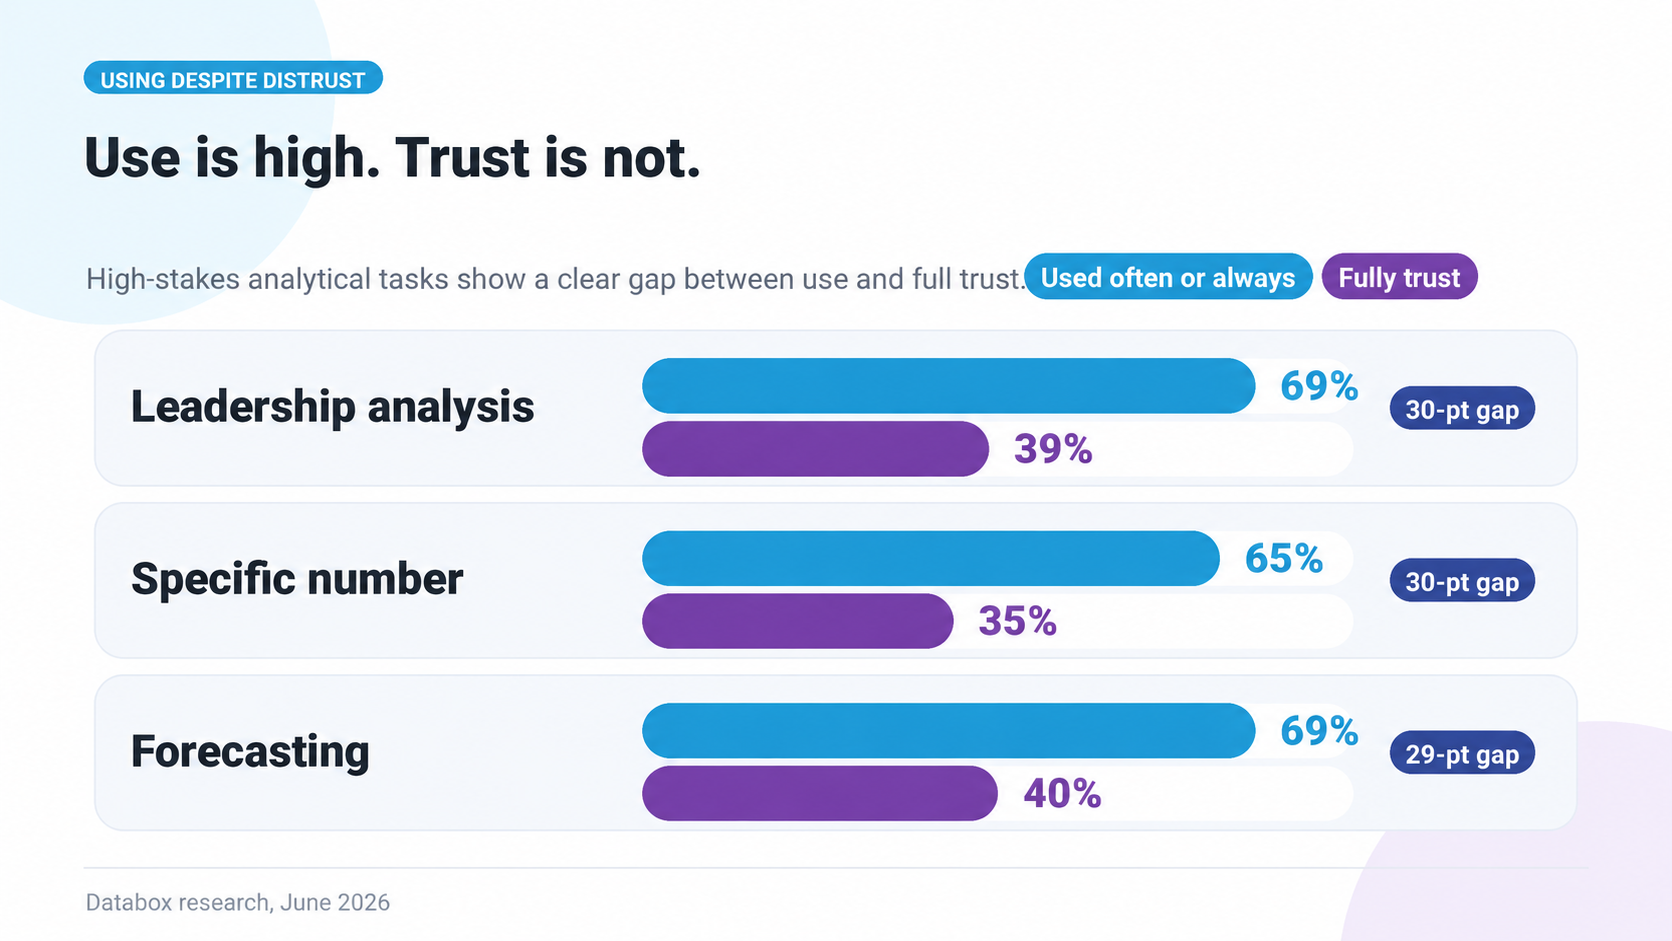
For analysis shared with leadership, board, or clients: 69% use gen AI often or always. 39% fully trust it for that work. For producing a specific number used in work: 65% use it. 35% trust it. For forecasting future values: 69% use it. 40% trust it.
Of the 17 respondents who explicitly say they don’t trust gen AI for forecasting, 15 used gen AI for forecasting anyway in the last 30 days. Distrust does not prevent use. It coexists with it.
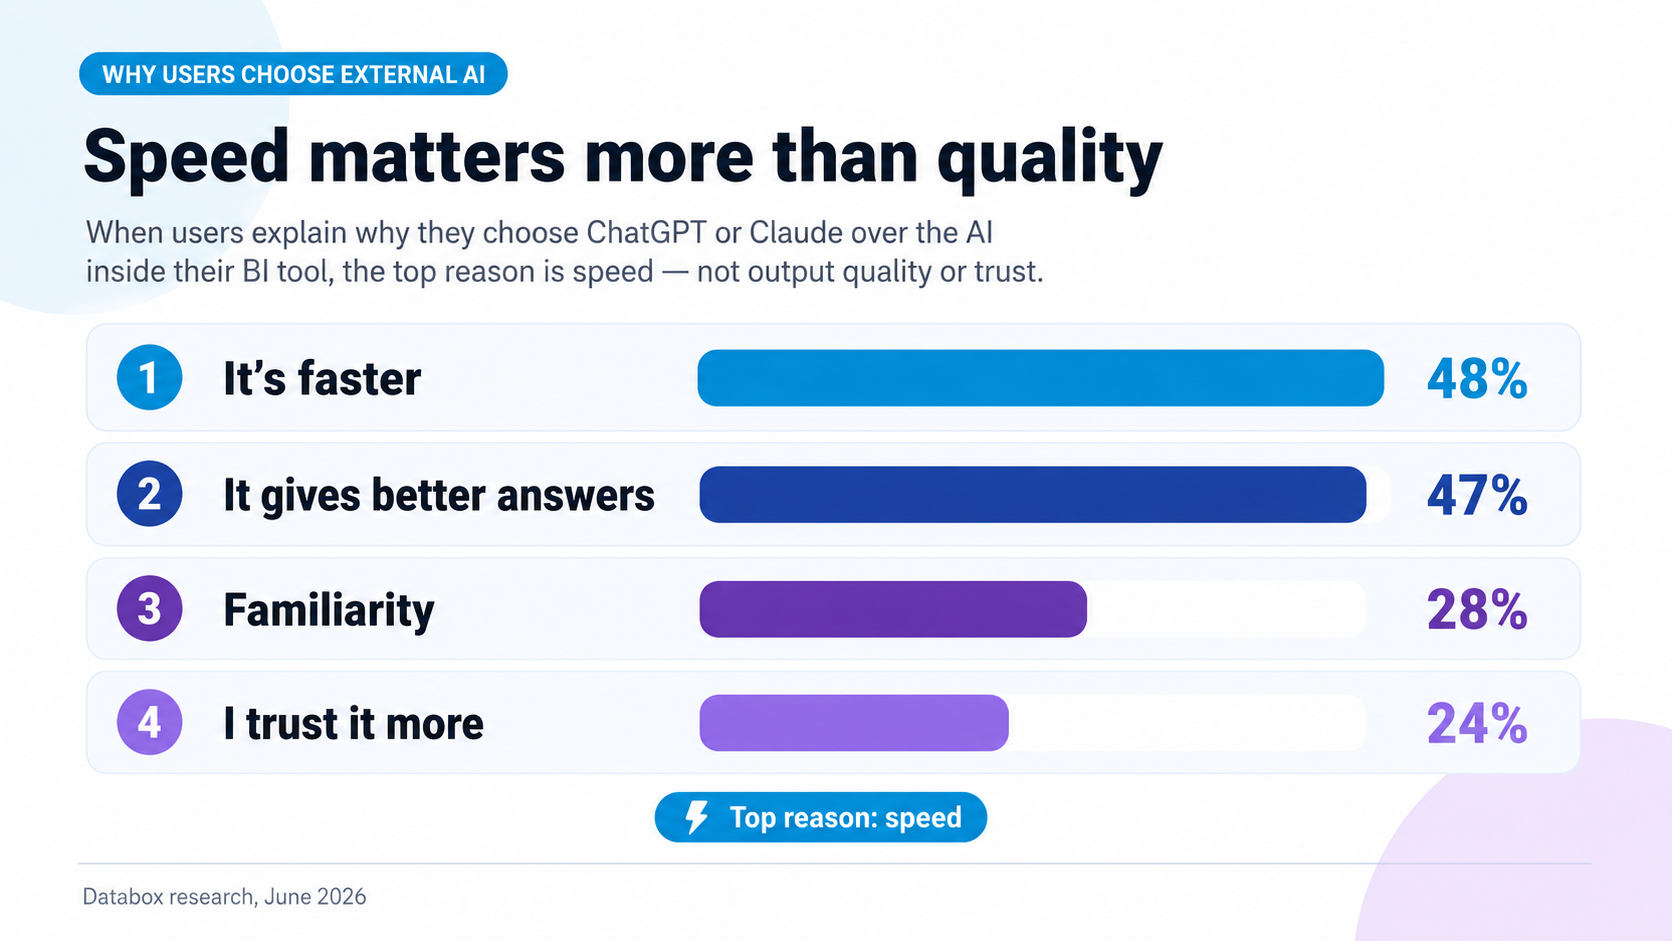
When users explain why they pick ChatGPT or Claude over the AI inside their BI tool, the top reasons are not about output quality. 48% say it’s faster. 47% say it gives better answers. 28% say familiarity. 24% say they trust it more.
Trust is not why users pick gen AI. It’s the fourth reason on the list, behind speed, accuracy, and habit. Users themselves don’t claim trust as why they’re using the tool they’re using. The over-trust framing fails its own evidence test.
"AI leans agreeable. Ask it whether something is a defensible adjustment, and it'll usually find a way to say yes, which is how you end up with a flattering number you can't defend the second a buyer's accountant looks at it. The math I'll delegate. What the math means, I won't."
Verification Theater
What business users call “verifying” is mostly not verification.
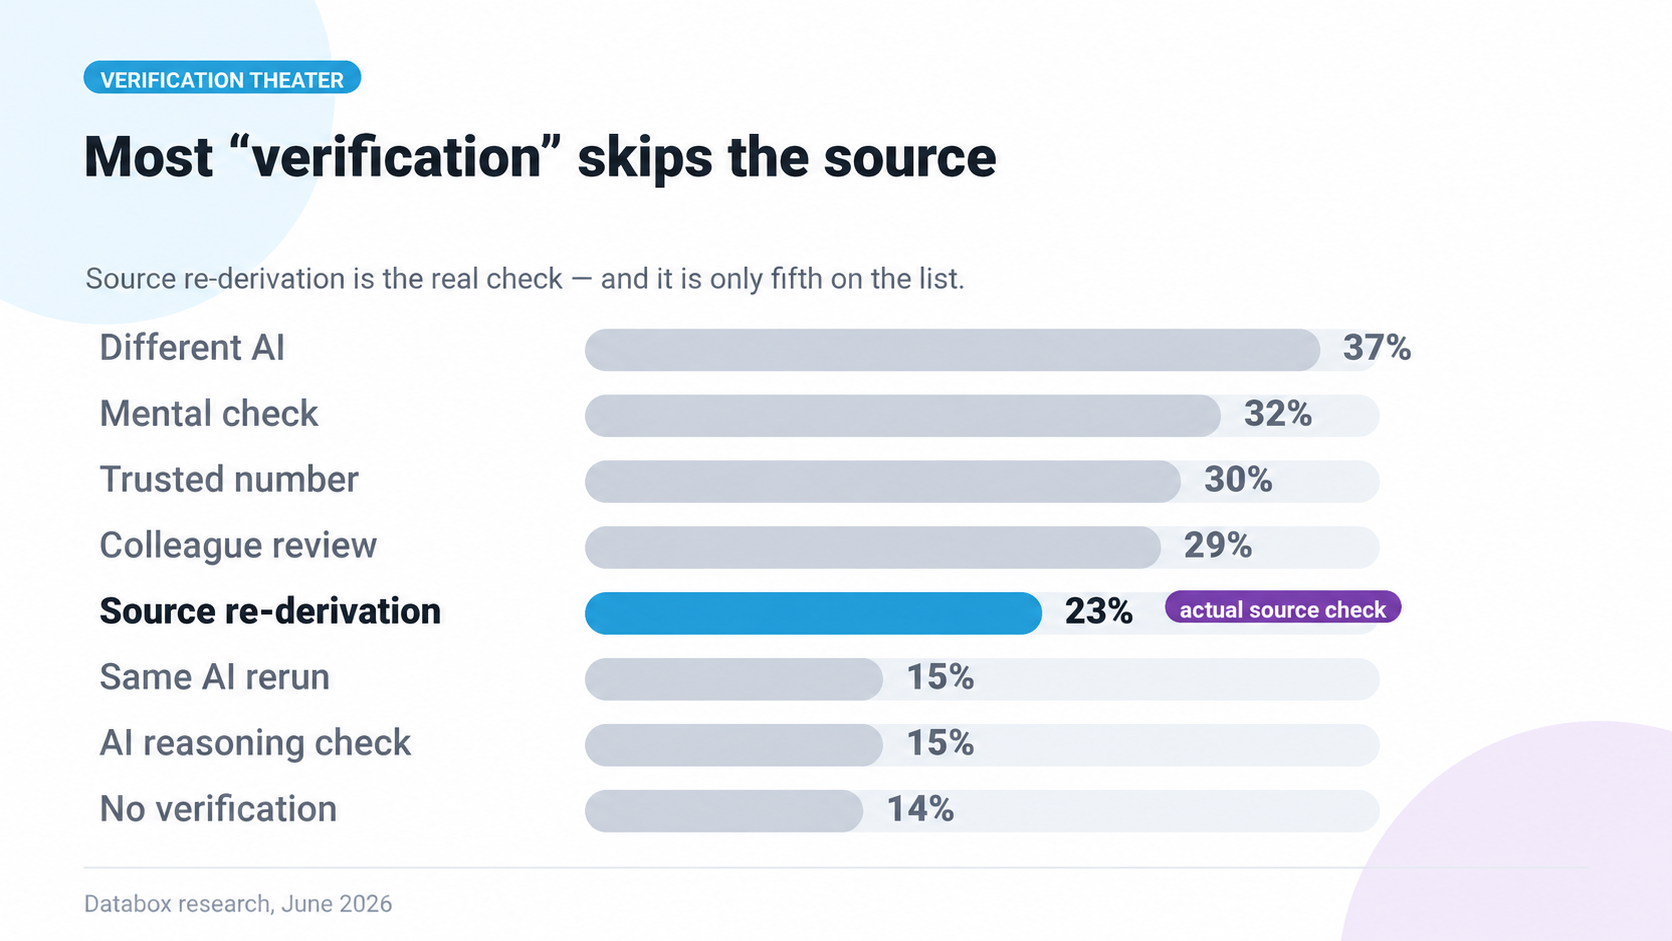
86% of business users selected at least one action they describe as verifying gen AI output in the last 30 days. 23% selected re-deriving the numbers from the source data. The remaining 63 of every 100 “verifiers” rely primarily on methods that do not involve checking against the source at all.
The most common method, by a wide margin: asking the same question to a different AI. 37% of all respondents did this in the last 30 days. It is verification only in the sense that it produces a second number. The second number comes from a different model with the same training corpus and the same hallucination class. A second guess is not a check.
The full list of what business users do and call “verification”:
- 37% asked the same question to a different AI
- 32% did a rough mental check (“does this feel right?”)
- 30% compared the answer to a number they already trusted
- 29% asked a colleague to look at it
- 23% re-derived the numbers from source data
- 15% re-ran the same prompt in the same AI
- 15% checked the AI’s reasoning step by step
- 14% said they hadn’t done anything they’d call verifying
23% of business users actually verify by re-deriving the number from the underlying data. Every other “verification” method either compares one AI answer to another, asks the AI to grade its own homework, or relies on the user’s mental model of what the right number should be.
The most common methods catch the fewest real errors. Among the engaged respondents who took the planted-error test, source-re-derivers caught nearly three times as many real errors as cross-AI-checkers.
This pattern came through in the open responses too. Chris Todd, a marketer at CTM, described asking AI to analyze a dataset of several hundred call transcripts to inform a voice assistant prompt rewrite. “It chose a sample size of 4 to provide confident analysis without disclosing the number.” A confident answer from a sample size of four reads identically to a confident answer from a sample of four hundred. The user gets a number. The user gets no signal that the number shouldn’t be trusted.
Errors Get Through
Even when business users are looking for errors, they miss most of them. Some invent errors that aren’t there.
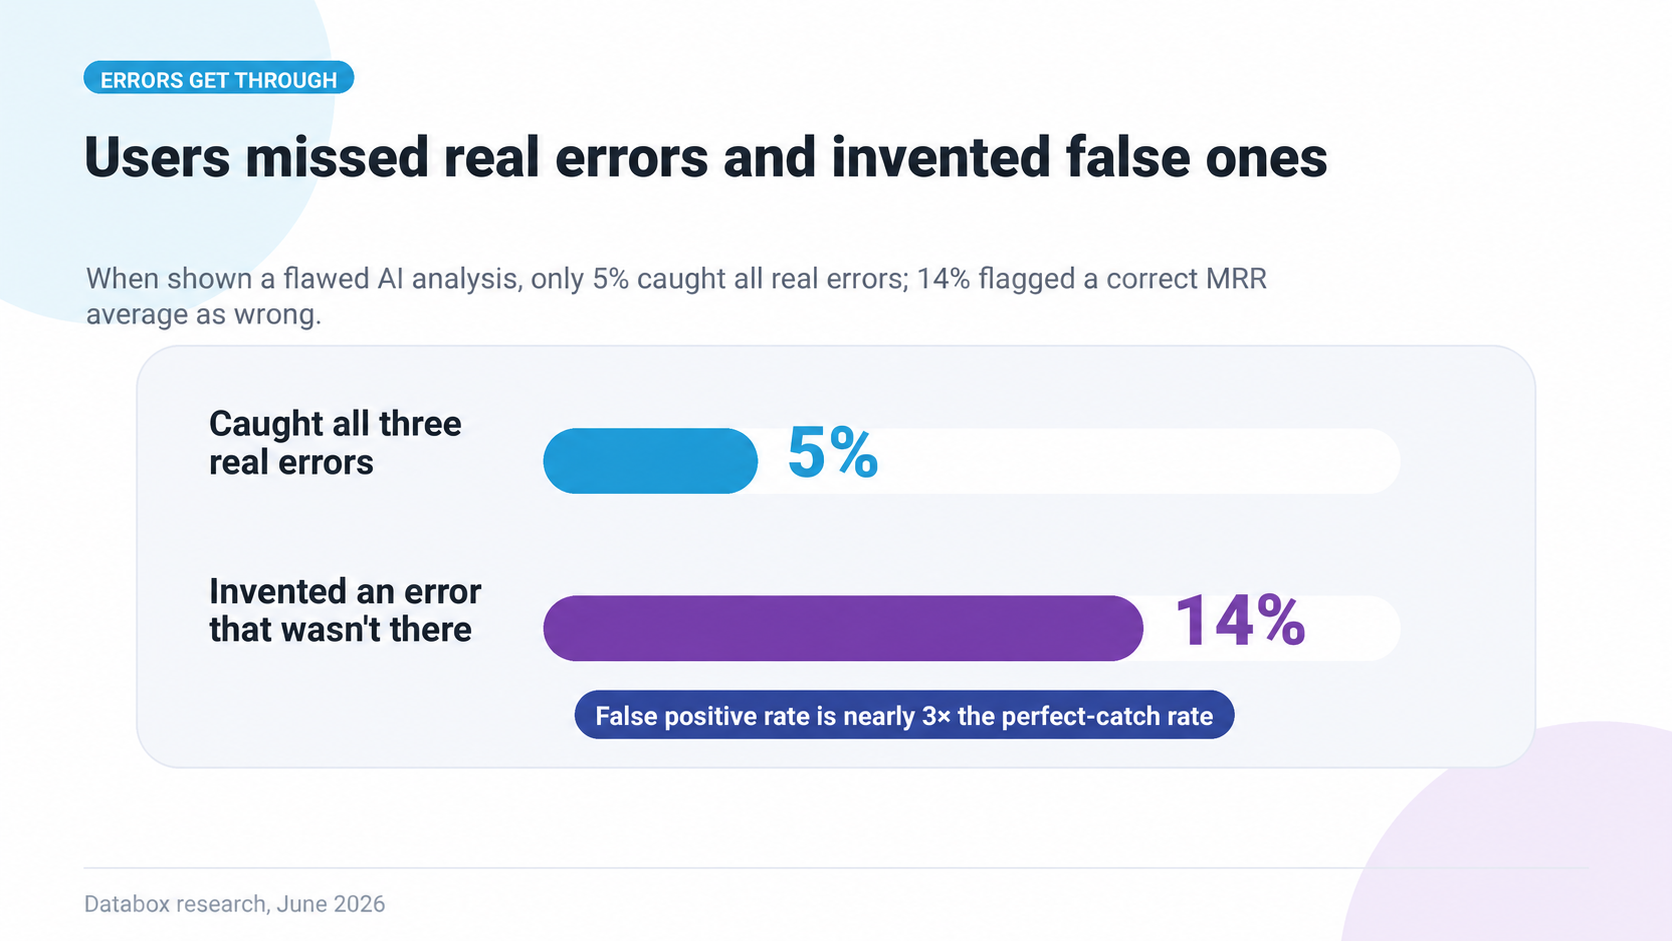
The survey included an interactive test. Business users were shown an AI-generated business summary that contained three real errors, alongside the underlying data they could check against. The selection list also included three distractor problems that weren’t actually wrong with the summary. Respondents could pick whatever they thought was a problem.
The results:
- 5% caught all three real errors
- 51% caught exactly one of three
- 25% caught zero
- 28% flagged at least one distractor as real
- 14% specifically said the MRR average was incorrect when the MRR average was correct
14% of business users flagged “the MRR average is incorrect” as a problem in the AI summary. The MRR average was correct.
The pattern is more telling than the number: when shown a flawed AI analysis, users pattern-match to “AI is probably wrong somewhere” without identifying where. They miss the actual errors and invent ones to replace them.
The static-summary version of this is benign. The user reads a wrong AI number, frowns, and most of the time moves on. The agentic version is not benign. An AI agent acting on a hallucinated number doesn’t pause for the frown.
"AI output that's correct item-by-item can still be wrong in aggregate. Quantity is an input the model gives you. Dosage is a judgment you give it back."
No Data Layer
The structural reason this keeps happening.
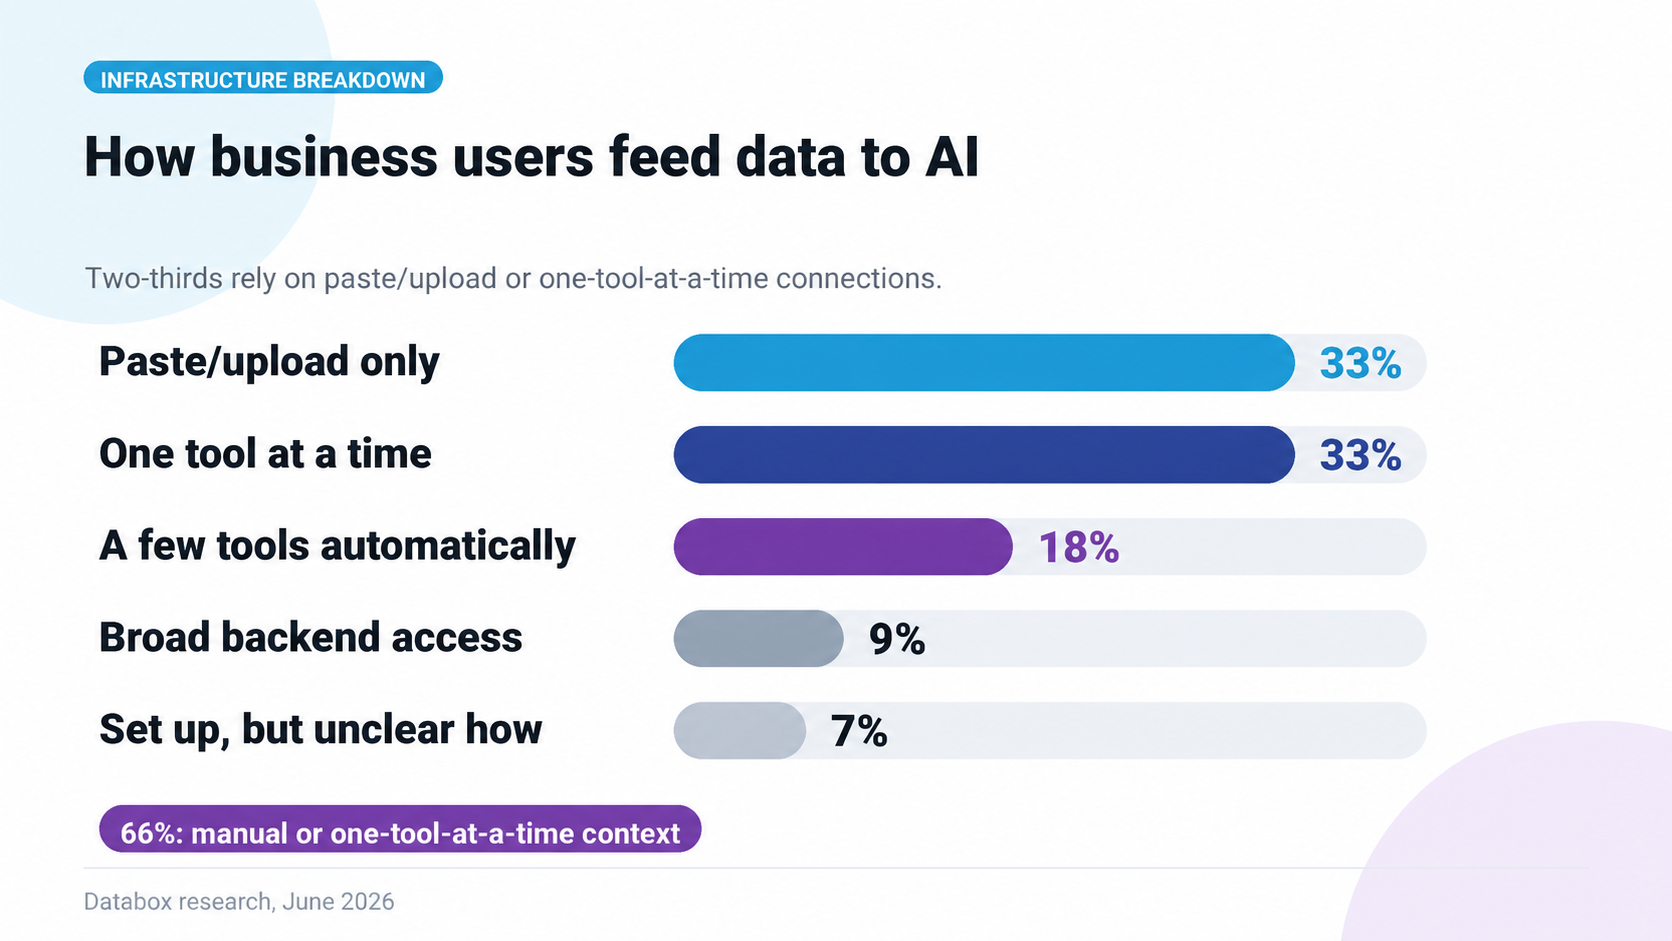
The infrastructure that would make AI analytics safe doesn’t exist for most users. Not because they don’t know it’s needed. Because building it has historically required a data engineering team, a semantic layer in dbt or LookML, and budget for both. Mid-sized companies usually don’t have either. The result is what every previous chapter described: 86% reaching for gen AI, 39% trusting the answer, 86% claiming verification, 23% actually re-deriving, 74% having shipped a wrong number. None of it gets fixed by users behaving better. The structural condition has to change.
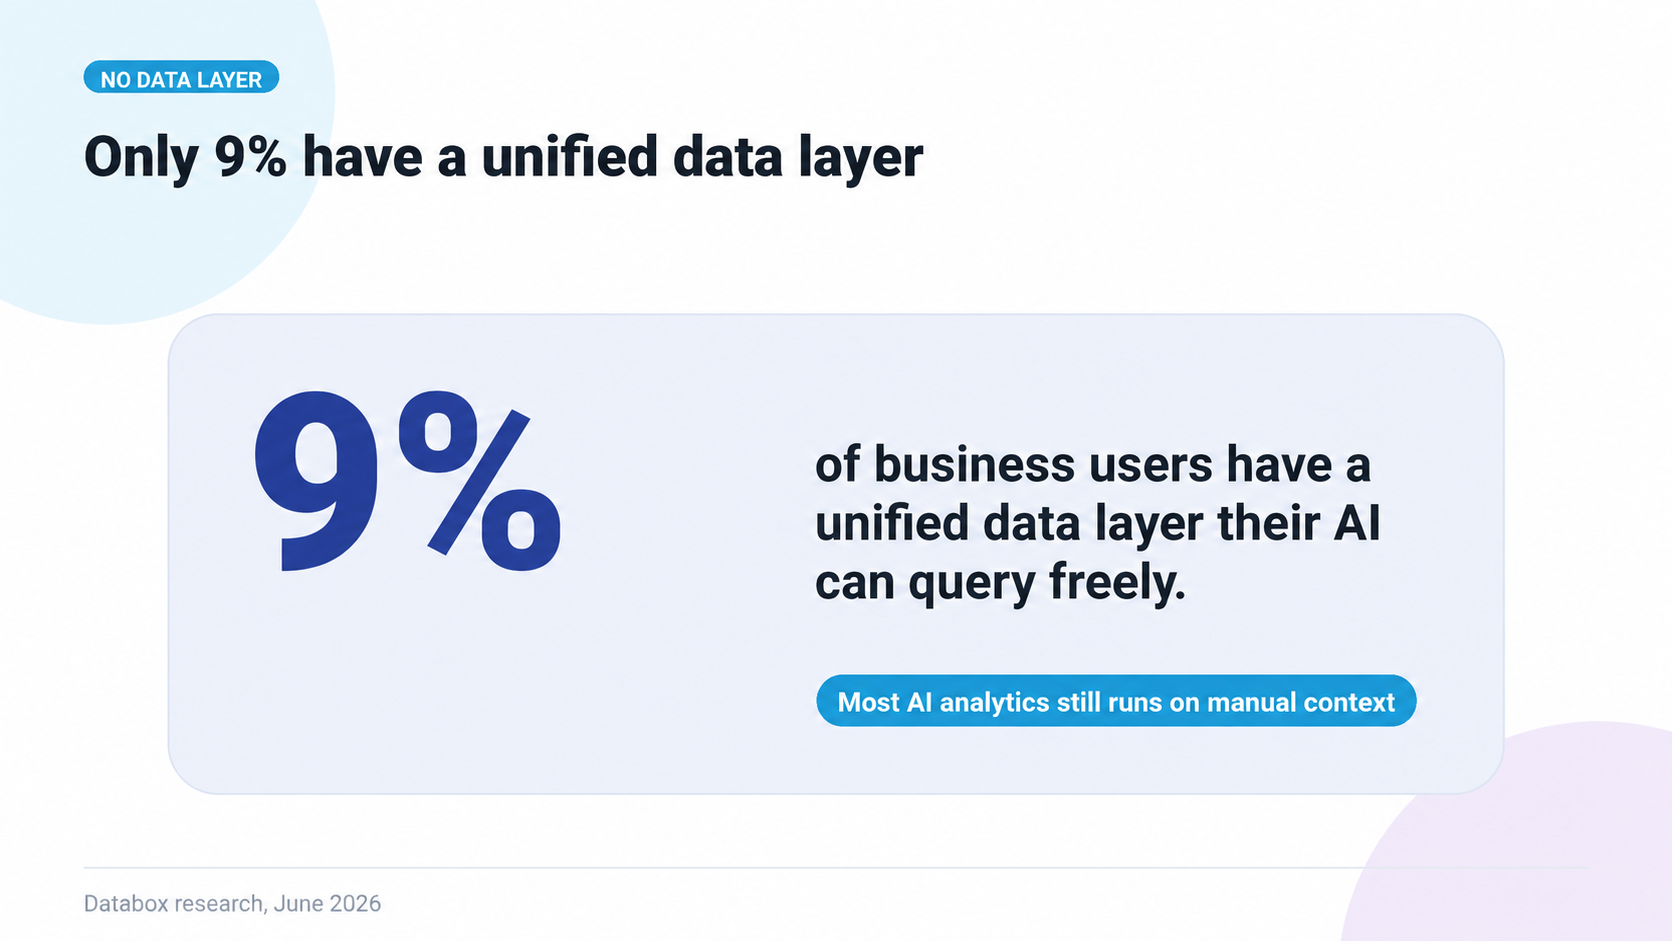
Only 9% of business users have a unified data layer their AI can query freely. 66% feed AI by paste, upload, or one-tool-at-a-time connections. Among the heaviest gen AI users, 80% have no layer at all.
The fight that matters is not which AI gets used. Users have decided. 86% reach for gen AI first.
The fight is what data their AI gets to read when they use it.
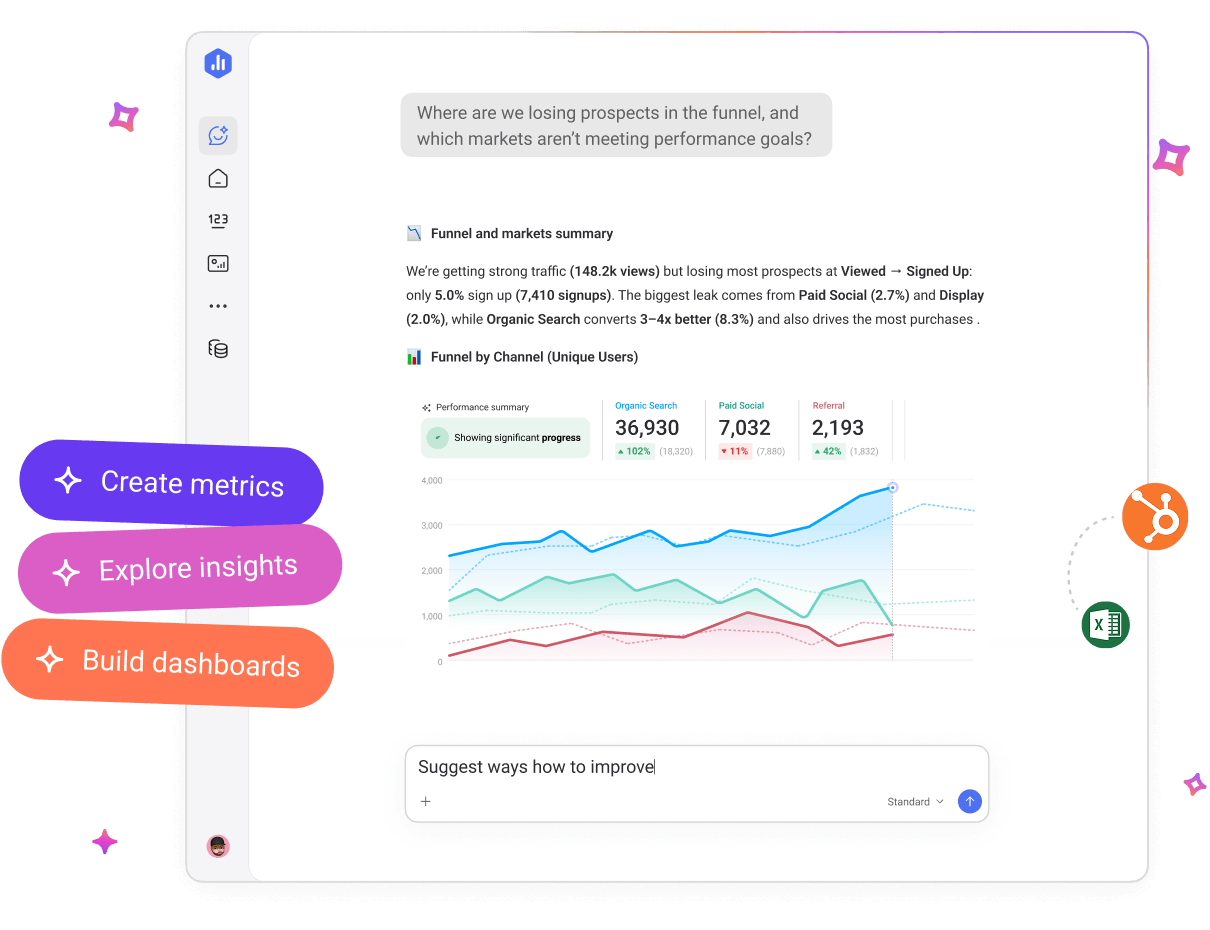
AI is only as good as the data you put into it
Unlike LLMs or standalone AI tools, Databox AI builds on the same trusted metrics, dashboards, and datasets your team already uses — so insights are accurate, contextual, and immediately actionable.
Chat with Genie, AI analyst, about your performance, use MCP to bring your performance data into AI tools your team already uses, like Claude, n8n, or ChatGPT or download free analytics skills, artifacts, and workflows from Skills Marketplace.
About the Research
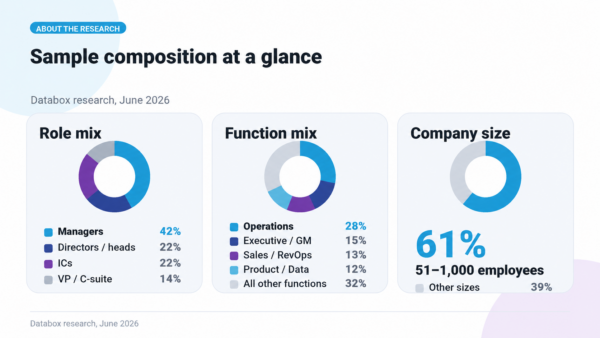
This research is based on responses from more than 100 business users surveyed in June 2026.
Sample composition:
- 42% managers, 22% directors and heads of, 22% individual contributors, 14% VP / C-suite / Founder
- 28% Operations, 15% Executive / General Management, 13% Sales / Revenue Ops, 12% Product / Analytics / Data, 9% Marketing, 9% Customer Success, 8% Finance / FP&A
- 61% from companies of 51 to 1,000 employees
- 44% report using gen AI daily for work involving analysis or business data
Want the full picture? Download the full report!
The blog version covers five findings. The full report covers all of them.
By submitting the completed form, you agree to our Terms of Service and Privacy Policy


compliant
certified