Centralize Data, Then Monitor, Share & Take Action, Faster

Growing businesses love the ease and beauty of Databox. Transform data chaos into a competitive advantage for all teams.

  • No Credit Card
  • Unlimited users on all plans
  • AWS Security Protocols

Trusted by 20,000+ growing businesses

Are scattered data, outdated reports, and rigid tools slowing you down?

We know juggling data from various sources can slow you down, making it tough to see the big picture, let alone act swiftly on new information. Databox pulls all your data into one place, giving you the power to quickly visualize performance trends and make informed decisions.
Struggling with scattered data across platforms?

Managing data from multiple platforms can be overwhelming and time-consuming. Databox centralizes your data into one intuitive platform, providing a complete view of your performance metrics. This way, you can easily spot trends and make data-driven decisions without the hassle of switching between tools.

Is reporting taking up too much time?

Manual reporting eats up valuable hours that could be spent on strategic initiatives. Databox automates your reporting by pulling the latest data into customizable templates, which can be shared directly through Slack or email. Spend less time compiling reports and more time focusing on growth.

Need faster insights for quicker decisions?

Slow, outdated insights can hold your team back. With Databox, you get real-time access to your most important data, enabling you to act swiftly when changes occur. Set up alerts for key metrics and receive instant updates so your team can adjust strategies proactively, not reactively.

Missing the tailored reports you need?

Off-the-shelf reports don’t always provide the specific insights your team needs. Databox allows you to customize your reports by combining data from various sources, applying filters, and creating custom metrics. This flexibility helps you focus on the KPIs that matter most to your business.

Sign up for a Free 14-Day Trial

No card required

Reduce manual, repetitive tasks and spend more time on what truly matters

Databox is your all-in-one platform to centralize, automate, and analyze data from all your sources in real time. Save time on manual tasks, provide stakeholders with clearer insights, and give leaders a complete view of performance.

Centralize all your data, quickly and easily

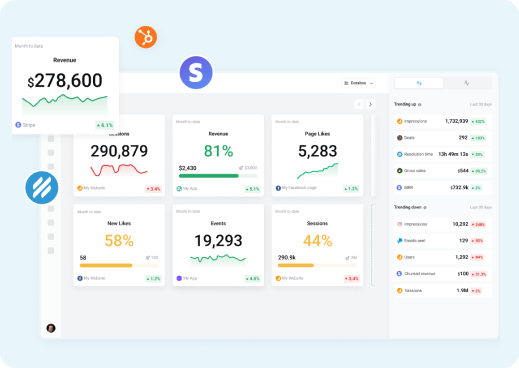
Stop juggling a dozen browser tabs, copying and pasting screenshots, and pasting numbers into a spreadsheet. Use Databox to securely store it one place. Track thousands of pre-built metrics, and combine multiple metrics to create custom ones for granular insights. Then tailor your Performance Screen to your preferences and easily monitor and access the metrics, goals, dashboards, and reports that matter most to you.

Easily create custom no-code dashboards with essential metrics

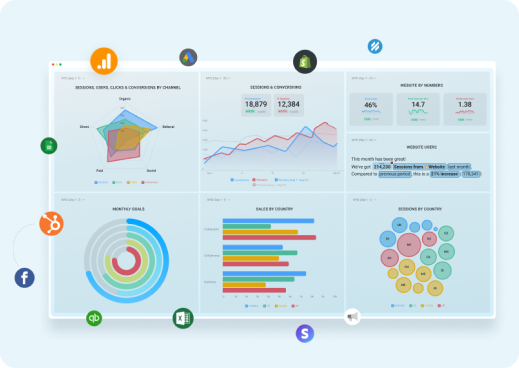
Build and share beautiful no-code dashboards using our drag-and-drop designer, integrating metrics from 130+ data sources. Choose between 100% customizable dashboards or utilize 1-click templates to expedite your workflow. Pick from variety of visualization types and filter data to your preference. Then standardize processes with account templates, connect dashboards in loops and add context that explain performance trends for continuous insight.

Plug your spreadsheets into Databox

Spreadsheets are cost-effective and powerful but fall short in sharing actionable insights. Databox’s Google Sheets integration enhances this by allowing you to easily select and visualize data from multiple sheets and ranges. With a few clicks, you can design dashboards that effectively communicate the necessary information to your team or clients. For non-conventional data structures, our Manual Setup lets you choose the right cells to display your data without any coding.

databox report formats

Put your reporting process on autopilot

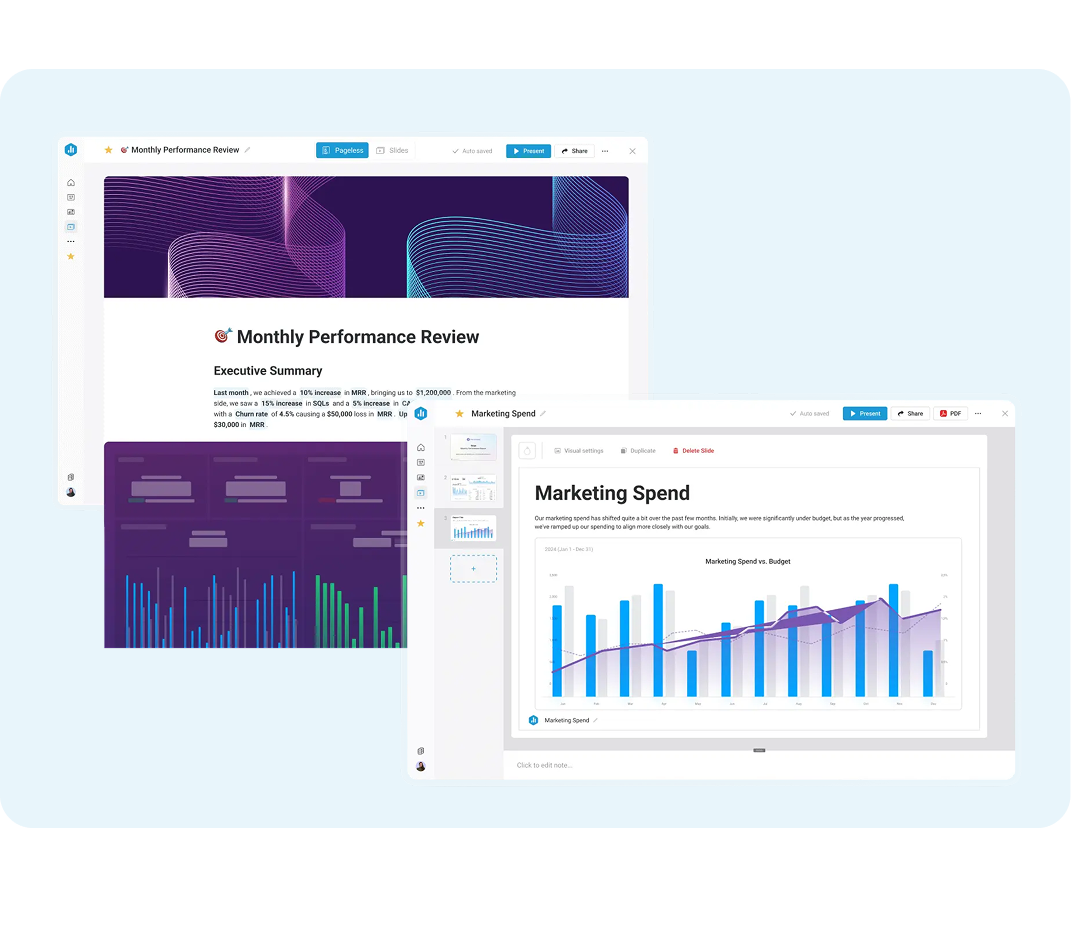
Build fully customizable reports that tell the full story—automatically. Choose from a long-form Page format for deeper insights or a Presentation format with speaker notes and full-screen mode. Embed your existing Databoards, Metrics, and Goals, style everything on-brand, and add dynamic elements or AI-generated summaries to make performance crystal clear. Then, put reporting on autopilot—deliver via PDF, email, or Slack without lifting a finger.

Stay alerted to key data changes or emerging trends

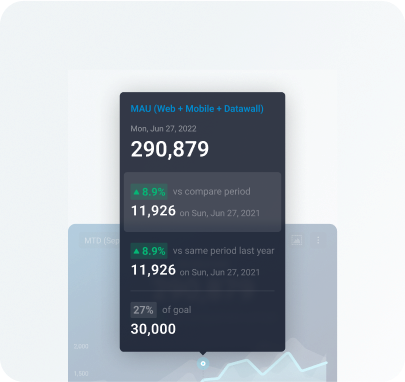
Proactively monitor your data and receive instant alerts on important changes. Set specific thresholds for increases or decreases in your key metrics or KPIs, ensuring you never miss critical shifts in your data landscape. This timely notification system empowers you to respond swiftly and strategically, keeping your operations aligned with your goals.

databox teams

Organize Data by Department, Fast

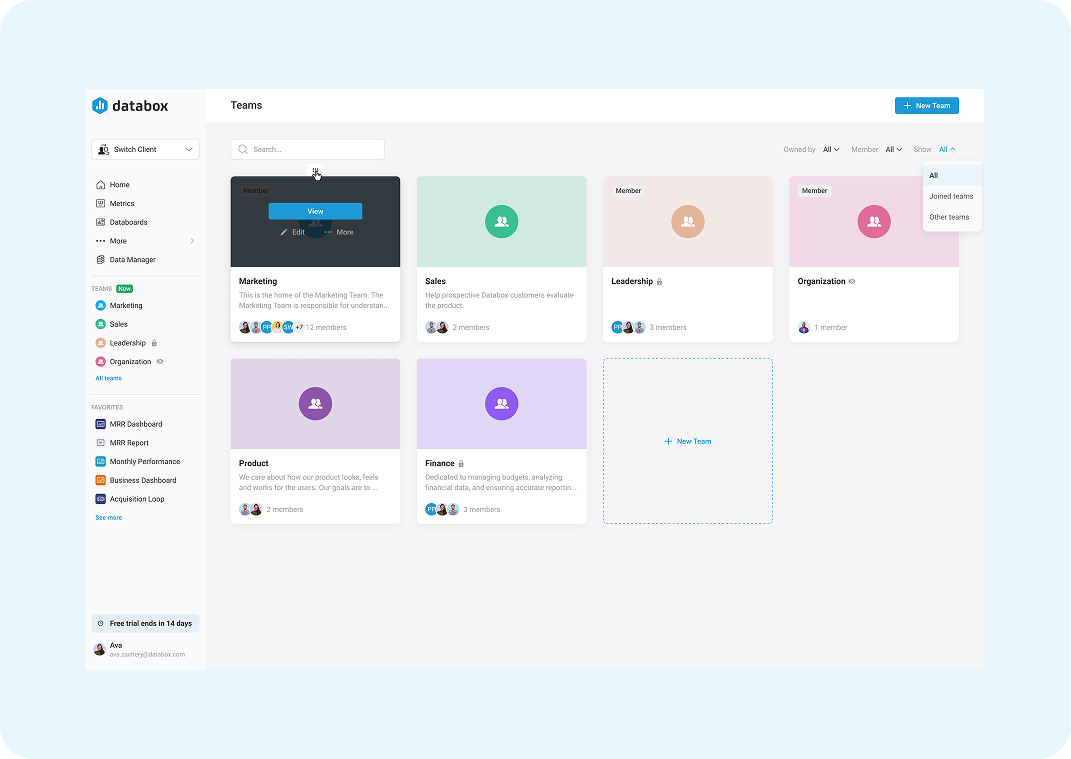
Create custom spaces for each team to access the Metrics, Databoards, and Goals that matter most—so everyone can stay aligned and move faster.

No Switching Between Platforms. Connect Every Integration You Need.

From Google Analytics 4 and Facebook Ads to LinkedIn and HubSpot, Databox makes it easy to pull in data from 100+ platforms your teams use most. These integrations are designed to save you time, reduce manual work, and provide a 360-degree view of your company’s performance.

And if you need important metrics from a different data source, no worries. You can connect powerful software integrations,  APIs, Databases and custom Spreadsheets. 

Your Software
Sync data from 100+ software tools
APIs
Sync custom data from a Cloud-Based app with API access
A Database
Use MySQL queries to pull data from your database
Spreadsheets
Track custom metrics from Google Sheets or Excel

Introducing the DIY BI

We took the best tools normally found in complicated enterprise analytics platforms and BI tools, and made them accessible and easy to use. Then we added AI to help you get those answers even faster. Perfect for teams who need data-informed answers, and analysts who don’t want to be a bottleneck!

Summarize performance with AI

Get AI-generated performance summaries to help stakeholders understand how you’re performing, and what to do next.

Put reporting on autopilot

Create reports with dynamic elements like metrics and date ranges to automate your reporting process.

Forecast future results

See how you’re likely to perform to make more informed decisions, set realistic goals, and craft better plans.

Compare yourself to industry benchmarks

Benchmark your performance to see where you’re outperforming others and find opportunities to improve.

Spot unusual patterns faster

View unusual increases or decreases in performance to quickly identify the cause and address them before they become bigger problems.

Analyze more historical data

See how you historically performed in the past to plan better for the future.

Flexible Analytics Tool for Any Use Case or Business Type

Whether you’re in SaaS, e-commerce, or running an agency, Databox makes it easy to bring all your data together. Connect with the tools you already use and customize dashboards to suit your team’s unique needs.

  • Agency
  • SaaS
  • E-Commerce
  • Agency

  • SaaS

  • E-Commerce

Put client reporting on autopilot

  • Free up your team’s time to invest in other areas of the business
  • See which clients need your attention, and prioritize their needs
  • Curate the data to only share what clients need, and filter out distractions

“One of my directors has spotted trends and rewritten and refilmed advertisements in a matter of days, because of what we were seeing in the dashboards. And rewrote a new release with the new launch strategy and completely turned around returns on investment.”


Andrew Campbell, Marketing Analyst & Technology Manager at Harmon Brothers

Trusted by brands like yours

Track and improve your GTM and product performance, all from one place

  • Track product and user metrics in one place, and share them with GTM teams
  • Identify the most effective channels for acquisition and retention
  • Get a comprehensive picture of your company’s health, from Marketing and Sales to Product and CS

“Databox is easy to use and allows us to use templates or create our own completely custom dashboards to track KPIs from many sources. It’s a great way for our team to get an overview of marketing performance and identify trends quickly.”

Eva Zelca, CMO at Accuranker

Trusted by brands like yours

Monitor and improve your store’s performance

  • Track your most important metrics from one place
  • Make data accessible and actionable for your entire team
  • Save time by automating repetitive reporting tasks

“We’ve seen significant improvements in oney saved and money spent. It gives us the ability to make decisions quickly and optimize faster. It’s gives us quite a boost.”

Jack Fowler, Growth Marketing Manager at Raddish

Trusted by brands like yours

Gather your teams around the numbers

Connect with your data on any device—whether on the go, on the big screen, or comparing trends over time.

MULTIPLE PERIOD COMPARISON

Compare current performance to multiple previous periods

Look back at multiple previous time periods, so you can do deeper analysis.

MOBILE APP

Check your dashboards anytime, anywhere

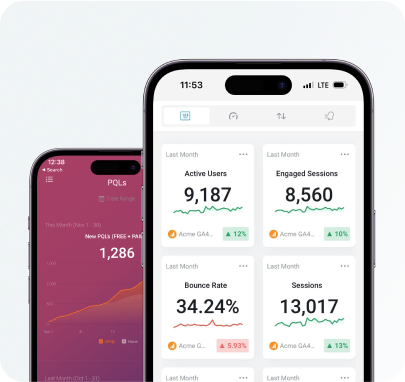
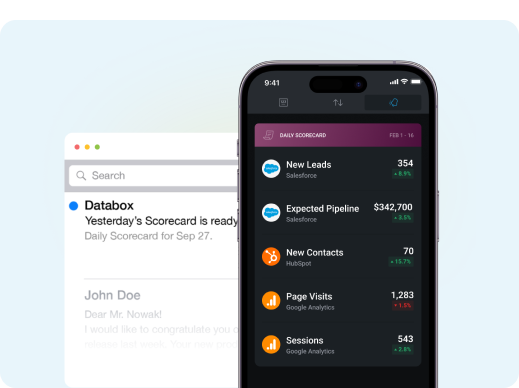
View how your team is performing anywhere, with our mobile app.

STREAM TO TV (UNIQUE TO DATABOX)

Project your dashboard to a TV

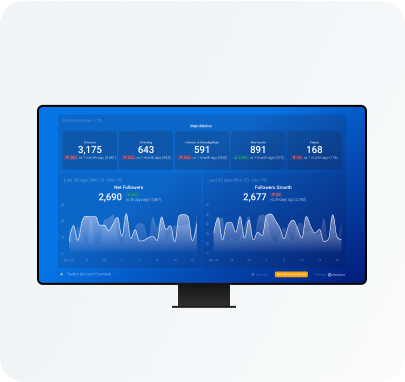
Share dashboards on TV screens to continuously display real-time performance, or present to your team or clients.

Simple to start, built to scale

Everyone starts with a 14-day trial of the Growth plan. Then choose the plan that best suits your needs.
Free
Basic reporting for individuals who want visibility into key metrics.
$ 0
3 Data Sources included
 
Get core features like:
  • Data updated daily This is the default sync interval for your data sources. You can adjust it per data source later if needed.
  • 1
    Dashboard Track the metrics that matter with fully customizable dashboards. Multiple visualization types, drag-and-drop layout.
  • 3
    Users Invite team members and set different permission levels to control what they can see and do.
  • 10
    Custom metrics Create custom metrics by adding calculations, filters, segments, and dimensions to your data.
  • MCP New Connect Databox to AI tools like ChatGPT or Claude to access trusted metrics and trigger actions, without leaving your workflow.

Pull data from:
  • 130+ cloud services (incl. marketing, e-comm, CRM)
Connect Data
  • 3 Data Sources included
  • 3 Data Sources limit
  • Connect 130+ cloud integrations
  • 11 months Historical data
  • 5GB Warehouse data storage
Prepare Data
  • 10 Create custom metrics
AI
  • Connect to AI tools (MCP server)
Visualize
  • 1 Build custom dashboards
  • Use pre-built dashboard templates
Analyze
Report
Monitor & Share
  • Stream dashboards to TV
  • Embed & share dashboards
  • Shareable links
  • Scheduled snapshots
  • Scorecards
  • Weekly metric digest
  • Chart annotations
  • Send updates to Slack
  • Alerts
Plan
Account Management and Security
  • 3 Add users
  • User permissions
Support & Services
Agency Features
View All Features
Pro
Business reporting & goal-tracking for teams that want easy, flexible visibility into their performance.
$ 159
/month
billed annually
3 Data Sources included
$5.6/mo per additional data source
Everything in Free, plus:
  • AI Analyst New Ask questions about your performance in plain language and get instant answers.
  • Data updated hourly This is the default sync interval for your data sources. You can adjust it per data source later if needed.
  • Unlimited dashboards Create as many dashboards as you need to track different teams, tools, or clients.
  • Unlimited users Invite as many team members as you need and set different permission levels to control what they can see and do.
  • Unlimited custom metrics Create as many custom and calculated metrics as you need to track what matters most to your business.
  • Reports Stay on top of your company or team’s performance with automated reports.
  • Goals Set goals for your team or company and track progress in real time.
  • Professional onboarding Go live faster with aligned metrics, clear goals, and a repeatable performance review cadence.

Additionally pull data from:
  • Spreadsheets (Excel) and Custom Integrations
Connect Data
  • 3 Data Sources included
  • Unlimited Data Sources limit
  • Connect 130+ cloud integrations
  • Connect data via Zapier/Make
  • Connect data via API
  • Connect spreadsheet data
  • 24 months Historical data
  • 20GB Warehouse data storage
Prepare Data
  • unlimited Create custom metrics
AI
  • Connect to AI tools (MCP server)
  • AI analyst
Visualize
  • unlimited Build custom dashboards
  • Looped dashboards
  • Use pre-built dashboard templates
  • Custom account templates
  • View media creatives
  • Refresh data on-demand
  • Single-dimension filtering
  • Add-on Fiscal calendars
Analyze
Report
  • Create automated reports
  • Presentation mode
  • Use pre-built report templates
  • Custom report templates
  • Archived Reports
  • Remove branding
  • Get performance notifications
Monitor & Share
  • Stream dashboards to TV
  • Embed & share dashboards
  • Shareable links
  • Scheduled snapshots
  • Scorecards
  • Weekly metric digest
  • Chart annotations
  • Send updates to Slack
  • Alerts
Plan
  • Create custom goals
  • Add-on OKRs
Account Management and Security
  • unlimited Add users
  • unlimited Create Spaces
  • User permissions
  • Single sign-on (SSO)
  • Add-on Advanced Security Management
Support & Services
  • Professional onboarding
  • Add-on Priority support
  • Add-on Dedicated reporting specialist (2h/mo)
  • Add-on Custom metrics & dashboard creation
Agency Features
  • unlimited Create client accounts
  • Client performance & goals overview
  • Custom account templates
  • Push template changes to dashboards or reports
  • Become a Solutions Partner
  • Bulk actions
  • Add-on View email activity
  • Add-on White label
View All Features
Growth
Advanced analytics and AI-generated analysis for teams that need deeper insights.
$ 399
/month
billed annually
3 Data Sources included
$5.6/mo per additional data source
Everything in Pro, plus:
  • AI Analyst New Ask questions about your performance in plain language and get instant answers.
  • Datasets New Prepare custom tables of raw data from one or more sources. Apply filters and calculate new columns to analyze and visualize your data however you need.
  • Raw data export & drilldown New See the raw data behind any metric, export it or drill down for details.
  • Data prep (merge, filter, calculate) Blend data from multiple sources, filter by dimension, and create custom calculated metrics.
  • AI-performance summaries Summarize your performance with AI.
  • Forecast modeling Forecast the future performance of any metric for the next month, quarter, or year. Model changes to explore scenarios and turn projections into goals with one click.
  • Anomaly detection Catch spikes, drops, and anomalies in your most important metrics.
  • Growth onboarding Go live faster with aligned metrics, clear goals, and a repeatable performance review cadence.

Additionally pull data from:
  • Databases and Cloud warehouses
Connect Data
  • 3 Data Sources included
  • Unlimited Data Sources limit
  • Connect 130+ cloud integrations
  • Connect data via Zapier/Make
  • Connect data via API
  • Connect spreadsheet data
  • Connect databases and warehouses
  • Integrations with dataset support
  • unlimited Historical data
  • 20GB Warehouse data storage
Prepare Data
  • unlimited Create custom metrics
  • Create datasets
  • Merge datasets
AI
  • Connect to AI tools (MCP server)
  • AI analyst
  • AI performance summaries
Visualize
  • unlimited Build custom dashboards
  • Looped dashboards
  • Use pre-built dashboard templates
  • Custom account templates
  • View media creatives
  • Refresh data on-demand
  • Single-dimension filtering
  • Add-on Fiscal calendars
Analyze
  • Drill down to row-level data
  • View anomalies
  • Export to CSV
Report
  • Create automated reports
  • Presentation mode
  • Use pre-built report templates
  • Custom report templates
  • Archived Reports
  • Remove branding
  • Get performance notifications
  • Add Data Stories
Monitor & Share
  • Stream dashboards to TV
  • Embed & share dashboards
  • Shareable links
  • Scheduled snapshots
  • Scorecards
  • Weekly metric digest
  • Chart annotations
  • Send updates to Slack
  • Alerts
  • Smart Alerts
Plan
  • Create custom goals
  • Forecasting & Modeling
  • Add-on OKRs
Account Management and Security
  • unlimited Add users
  • unlimited Create Spaces
  • User permissions
  • Single sign-on (SSO)
  • Add-on Advanced Security Management
Support & Services
  • Growth onboarding
  • Add-on Priority support
  • Add-on Dedicated reporting specialist (2h/mo)
  • Add-on Custom metrics & dashboard creation
Agency Features
  • unlimited Create client accounts
  • Client performance & goals overview
  • Custom account templates
  • Push template changes to dashboards or reports
  • Become a Solutions Partner
  • Bulk actions
  • Add-on View email activity
  • Add-on White label
View All Features
Premium
Best value
Enterprise-grade service and security for larger companies that need more support.
$ 799
/month
billed annually
50 Data Sources included
$5.6/mo per additional data source
Everything in Growth, plus add‑ons:
  • AI Analyst New Ask questions about your performance in plain language and get instant answers.
  • White-labeling ($200 value) White label Databox to offer clients your own custom branded reporting solution.
  • OKRs ($160 value) New Track company-wide and nested goals and align every team’s efforts toward measurable outcomes, all in one place.
  • Advanced security ($80 value) Meet internal security standards with advanced security settings like Force SSO, Force 2FA, Activity Log, Login Records, and more.
  • 15-min sync ($72 value) Choose 5 data sources to sync every 15 minutes and keep your most important data up to date.
  • Fiscal calendar ($40 value) Select a fiscal calendar as your date range to monitor performance based on your financial year.
  • Reporting specialist ($160 value) Meet with a Databox expert twice a month who provides ongoing dashboard reviews, key insights, and continuous reporting improvements as your business evolves.
  • Priority support ($80 value) Get faster responses by moving your cases to the top of our chat and email support queue.
  • Premium onboarding Go live faster with aligned metrics, clear goals, and a repeatable performance review cadence.

This plan includes data sources and add‑ons valued at $1,032
Connect Data
  • 50 Data Sources included
  • Unlimited Data Sources limit
  • Connect 130+ cloud integrations
  • Connect data via Zapier/Make
  • Connect data via API
  • Connect spreadsheet data
  • Connect databases and warehouses
  • Integrations with dataset support
  • unlimited Historical data
  • unlimited Warehouse data storage
Prepare Data
  • unlimited Create custom metrics
  • Create datasets
  • Merge datasets
AI
  • Connect to AI tools (MCP server)
  • AI analyst
  • AI performance summaries
Visualize
  • unlimited Build custom dashboards
  • Looped dashboards
  • Use pre-built dashboard templates
  • Custom account templates
  • View media creatives
  • Refresh data on-demand
  • Single-dimension filtering
  • Fiscal calendars
Analyze
  • Drill down to row-level data
  • View anomalies
  • Export to CSV
Report
  • Create automated reports
  • Presentation mode
  • Use pre-built report templates
  • Custom report templates
  • Archived Reports
  • Remove branding
  • Get performance notifications
  • Add Data Stories
Monitor & Share
  • Stream dashboards to TV
  • Embed & share dashboards
  • Shareable links
  • Scheduled snapshots
  • Scorecards
  • Weekly metric digest
  • Chart annotations
  • Send updates to Slack
  • Alerts
  • Smart Alerts
Plan
  • Create custom goals
  • Forecasting & Modeling
  • OKRs
Account Management and Security
  • unlimited Add users
  • unlimited Create Spaces
  • User permissions
  • Single sign-on (SSO)
  • Advanced Security Management
Support & Services
  • Premium onboarding
  • Priority support
  • Dedicated reporting specialist (2h/mo)
  • Add-on Custom metrics & dashboard creation
Agency Features
  • unlimited Create client accounts
  • Client performance & goals overview
  • Custom account templates
  • Push template changes to dashboards or reports
  • Become a Solutions Partner
  • Bulk actions
  • View email activity
  • Add-on White label
View All Features

Build your first dashboard in 5 minutes or less

Test drive every feature Databox has to offer with our 14-day Growth plan trial. After the trial, you can choose the plan that best suits your needs.

Get Full 14-Day Access Free Today No Credit Card. Cancel Anytime.

Trusted by 20,000+ growing businesses

G2 4.8 stars
Enterprise High Performer Winter 2024 award, Europe Winter 2024 Leader award, Small Business Leader winter 2024 award
Capterra 4.5 stars

Frequently asked questions

How do you protect privacy and ensure security?

We take data security very seriously. Amazon is our hosting partner, and our servers are hosted in a world-class data center with the most advanced security protocols. Read more about how we protect and ensure the privacy of your data.

What happens after my free trial?

During the 14-day trial, you can purchase a paid plan and your first payment will be at the end of the trial period. If you do not purchase, the trial will simply expire. We do not require a credit card to start a trial.

Can I create dashboards combining data from different sources?

Yes! In fact, we recommend doing this to get a comprehensive view of performance. Inside the dashboard builder, you can swap through different data sources you’ve connected and pull whatever metrics you need right into your dashboard. 

How can I share my dashboard?

In Databox, you have multiple sharing options.

  1. Shareable Link: Dashboards can easily be shared and accessed through a link. It will display your dashboard(s) with the same date range options and visualizations you have set in your account. Shareable Links are best for sharing live data with your teams, executives, or clients. 
  2. Scheduled Snapshots: You can export your dashboards into PDFs or JPGs at regular time intervals. Scheduled Snapshots are best for sharing static views of your data (regularly) with the relevant recipients. The best part is that recipients don’t need to be Databox users.
  3. Embeds: You can embed your dashboards on web pages or tools like ClickUp/Notion. Embeds allow you to incorporate your insights directly into your existing workflow. 
  4. Stream To TV: With Databox, you can easily stream your dashboard on a Smart TV. This option is valuable for sharing insights in office settings, team meetings, or presentations. 

How can I share a Report?

Our business reporting tool allows you to share multiple ways:

  1. Download as PDF: You can choose to share your Reports by downloading them as PDFs. This format allows you to easily share via email or store your reports as needed.
  2. Send to Email: You can send an email (either immediately or scheduled) to any email address from within the Reports Editor. All you have to do is enter the recipient’s emails, the subject of the message, and any additional text you would like to include.
  3. Send to Slack: Reports can also be sent to Slack channels, either immediately or at a scheduled date and time.
  4. Automate: You can set a schedule to automatically export the Report daily, weekly, monthly, or quarterly.

Can I change the logo and customize my dashboard?

Yes, you can change the colors of your dashboards and charts. And customize the logo on your dashboards to reflect your brand. Even better, you can provide create a fully branded experience with the white-label add-on. Personalize the login screen, URL, mobile app, and much more.

Can I combine multiple dashboards?

Yes! Dashboard Loops allows you to group multiple dashboards together to tell a more comprehensive story with your data. They’ll be joined together on one Shareable link that you can then share with your team and/or clients. You can add up to 20 dashboards to a loop.

Can I view my dashboards on my phone?

Yes, using our Databox mobile app for iOS and Android. And, you can receive your daily scorecards, weekly summaries, and performance alerts directly to your mobile phone.

All Databox software and customer data are securely housed within Amazon AWS infrastructure, ensuring compliance with AWS security certifications and GDPR standards.

AWS security certification and GDPR compliant badges