What you’ll learn from this ChartMogul Account Overview Dashboard Template
By connecting your ChartMogul account, you’ll learn:
- How much income did my business generate last month? View the amount of money your company generated from selling its products and services, along with costs incurred. Also, see how much in total profits your business made after deducting all expenses in a year.
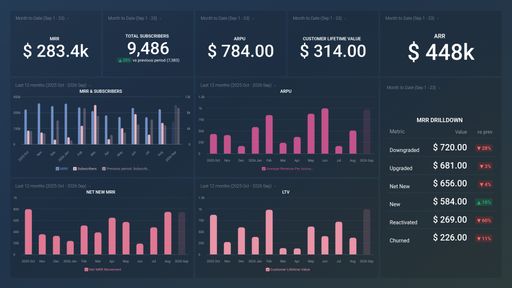
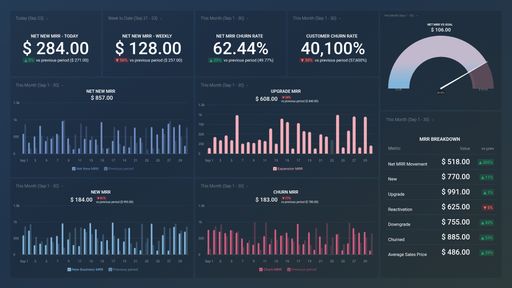
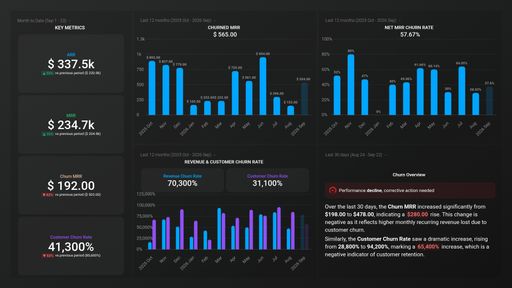
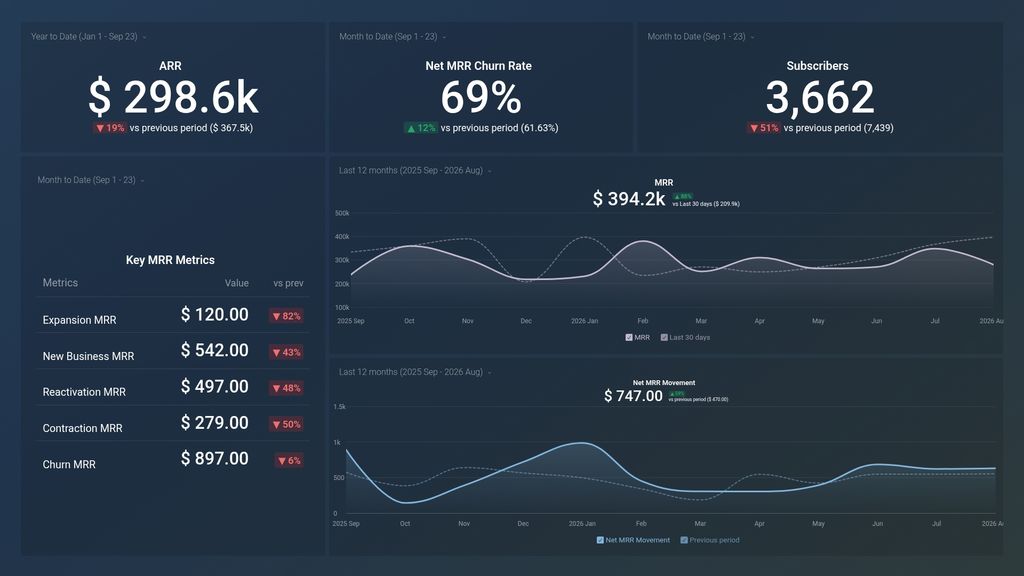
- Is my Net MRR Churn Rate increasing or decreasing? Being able to monitor this will help you make relevant business decisions in real-time rather than wait until the end of the month or quarter to take steps.
- Discover your Net MRR movement, MoM. You can drill down on what influenced your Net MRR the most by noticing changes month over month and then drilling down deeper to see what could be the root causes of those changes.
- Track your Key MRR metrics. By tracking where your MRR comes from, expansion, reactivation, and new business, you will understand better which areas are attracting the most profit month over month and take steps to ensure that there is an upward trend for these metrics.
Pull additional data using our robust integration with ChartMogul.
What other campaign metrics can you track and visualize with our integration with ChartMogul? Almost anything:
- Cash flow forecast
- Customer balance
- Income & Sales by customer
- Purchases by vendors
- Inventory valuation
- Budget & forecasting
In Databox there are dozens of ChartMogul metrics already built and ready for you to visualize in a variety of different ways. With the use of Metrics Builder and Data Calculations, the range of different metrics and metric combinations you can track from ChartMogul widens.
Read more about Databox's ChartMogul integration.
Explore more ChartMogul dashboards.