Uses one-click integrations:
-
 LinkedIn Ads
If you don't use LinkedIn Ads, you can pull data from any of our 130+ one-click, native integrations or from spreadsheets, databases and other APIs.
Try this dashboard for freeWhat you’ll learn from this LinkedIn Ads Dashboard Template
Integrating your LinkedIn Ads account will provide valuable information on how your ads are performing and how you can track key metrics on our LinkedIn Ads performance dashboard.
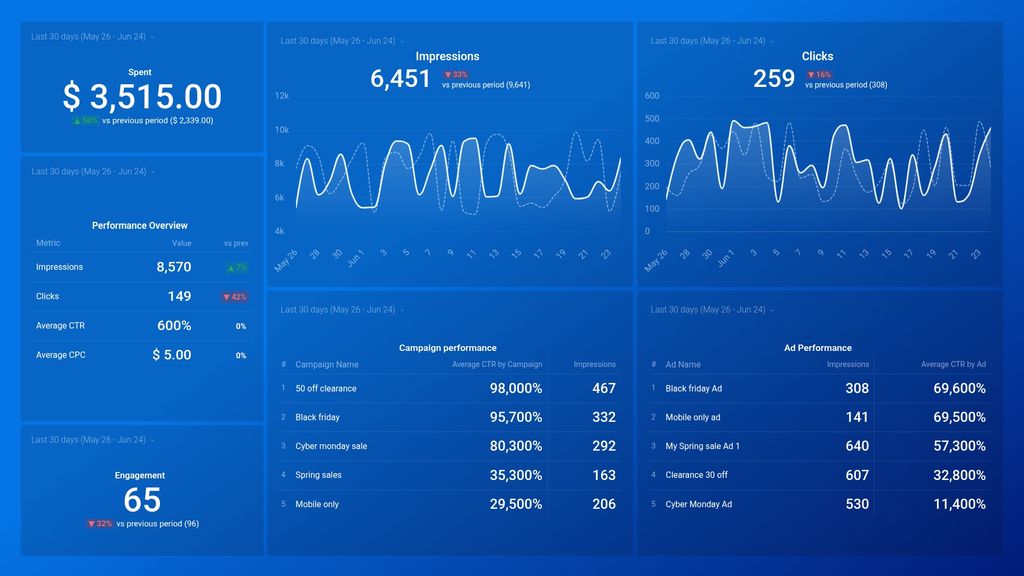
In what ways can I check my advertisement's impression metrics on LinkedIn?
Check the number of impressions LinkedIn users have contributed to within the timespan you set. Identify any rises or falls regarding the frequency of impressions within a 24-hour period. If there is a drop in impressions, most likely the ad objective and targeting parameters require modification and testing.
How many LinkedIn users are engaging with my Ads?
You can click on the relevant link in your advertisement to find out how many times the links in your ad are clicked. If the ad seems appealing, it is expected to be clicked frequently, confirming engagement behavior.
How do I evaluate my LinkedIn ads campaigns and their performance?
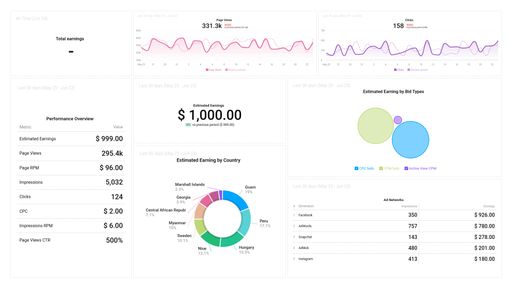
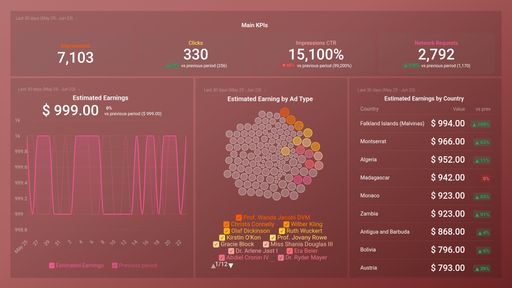
Measure and observe the most crucial LinkedIn Ads metrics, including impressions, clicks, and ad impact on your LinkedIn Ads account. Additionally, track the number of ads seen, clicks performed, Click-Through Rate (CTR), and Cost-Per-Click (CPC). It is easy to track these patterns with our LinkedIn Ads report template, allowing you to refine your strategy based on real-time data.
What was our expenditure on LinkedIn advertising for last month?
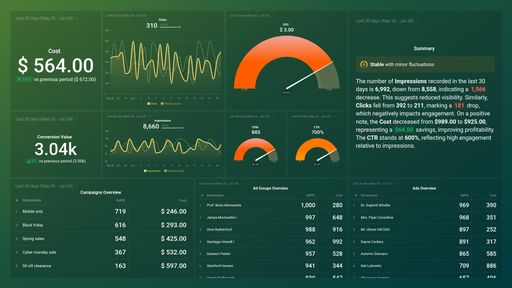
Check your report to view the cost of showing your advertisements to LinkedIn users in the past seven days, one month, quarter, or year. Based on your expectations and objectives, you may decide to alter your advertising budget.
How can I see how my LinkedIn ad performed at engagement?
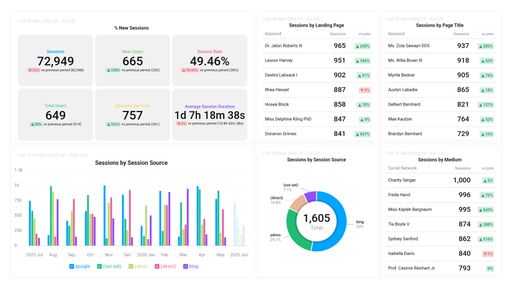
Check the engagement rate for your LinkedIn ad from the Ad Manager dashboard and compare it with the defined time period. Pull additional insights with our LinkedIn Ads data studio template to refine your engagement strategy.
What other features can you track and visualize using our advanced integration with LinkedIn Ads?
Almost anything when it comes to campaign performance analysis, including:
Impressions, clicks, and conversions
Cost per impression, cost per lead, cost per conversion
Lead generator form completion rate
Message Ad engagement
Ad Campaign, Ad Group, and Ad engagement rates
Your LinkedIn Ads templates can yield countless metrics and metric combinations. And with Databox, you can quickly visualize dozens of LinkedIn Ads metrics in various ways.
Read more about Databox’s LinkedIn Ads integration.
LinkedIn Ads metrics included in this template
-
Average CTR by Ad
The Average CTR (Click-Through Rate) by Ad metric shows the average percentage of clicks an ad receives per impression. It provides insight into the ad's effectiveness in driving user engagement and can be used to optimize ad performance.
-
Impressions
Impressions is a metric that measures the total number of times your ad was shown to LinkedIn users, regardless of whether they clicked on it or not.
-
Engagement
Engagement is a metric that measures how users interact with your content on LinkedIn. This can include likes, comments, shares, and clicks.
-
Spent
Spent is a metric that indicates how much money has been paid for LinkedIn Ads campaign or set of campaigns. It is the total amount of your advertising spend during a specific time period.