Uses one-click integrations:
-
 YouTube
If you don't use YouTube, you can pull data from any of our 130+ one-click, native integrations or from spreadsheets, databases and other APIs.
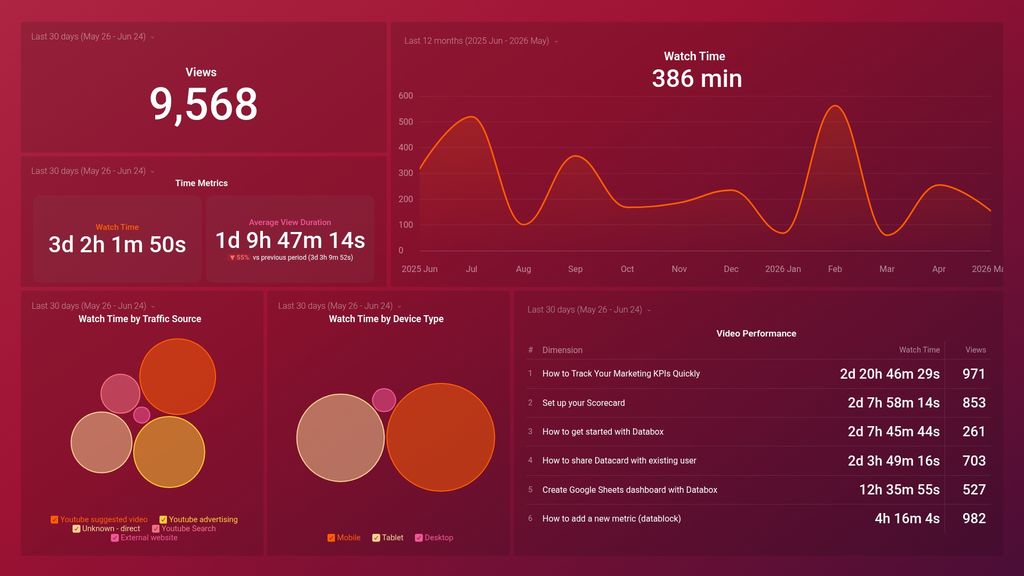
Try this dashboard for freeYouTube Watch Time Analysis Dashboard Template
What you’ll learn from this YouTube Watch Time Analysis Dashboard Template:
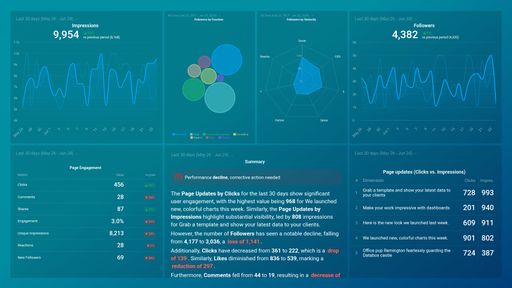
- How long do people spend watching my YouTube videos? Find out the total amount of time (in minutes) people spend watching your YouTube video(s) over a given period of time. Monitor this metric on a daily basis and quickly act on irregularities such as dips or spikes in your videos’ watch time. Use this metric to improve your video strategy as the longer people spend watching videos on your channel, the more likely is YouTube to highlight your video(s) in search and recommended videos.
- Which are my best-referring traffic sources? Learn about how viewers find your videos (whether through search, suggested videos, external referral, channel pages, and so on). Find out which of these traffic sources drives the most engaged video audience. This will let you know which channels to prioritize in your audience acquisition efforts.
- How long, on average, do people spend watching my videos? Measure your video’s engagement by tracking how long, on average, people spend watching your videos. The higher your average view duration, the better your chances of having YouTube promote your videos in its search pages or the suggested videos section.
- How many times have my videos been watched? See the total number of times your YouTube videos have been watched, including repeat views from the same viewer. Additionally, find out the number of views each video on your channel has accumulated. This information is valuable as it informs you about the popularity of your videos and your best-performing topics.
- How do I track my watch time across devices? See the total number of minutes people spend watching your videos and the type of device used by your audience to do so (i.e., mobile, desktop, and tablets). Use this data to optimize your videos accordingly to ensure optimum user experience and engagement.
Pull additional data using our integration with YouTube.
What other YouTube metrics can you track and visualize with our integration with YouTube?
- Identify your traffic sources
- Learn audience demographics
- Viewer retention
- Subscriber count
- Video engagement
- YouTube referrals, and more.
There are numerous metrics and metric combinations you can track using YouTube. And in Databox, you can quickly visualize dozens of YouTube metrics in a variety of different ways.
Read more about Databox’s YouTube integration.
Explore more YouTube dashboards.
YouTube metrics included in this template
-
Watch Time by Device Type
Watch Time by Device Type is a metric that measures the total amount of time viewers spend watching YouTube videos on various devices such as mobile, desktop, and TV. It helps creators and advertisers understand how viewers engage with their content across different platforms.
-
Watch Time by Traffic Source
Watch Time by Traffic Source is a YouTube metric that measures the total amount of time viewers spent watching your videos from different sources such as YouTube search, suggested videos, and external links. It helps you understand which traffic sources are driving the most engagement and views to your channel.