Uses one-click integrations:
-
 Stripe
If you don't use Stripe, you can pull data from any of our 130+ one-click, native integrations or from spreadsheets, databases and other APIs.
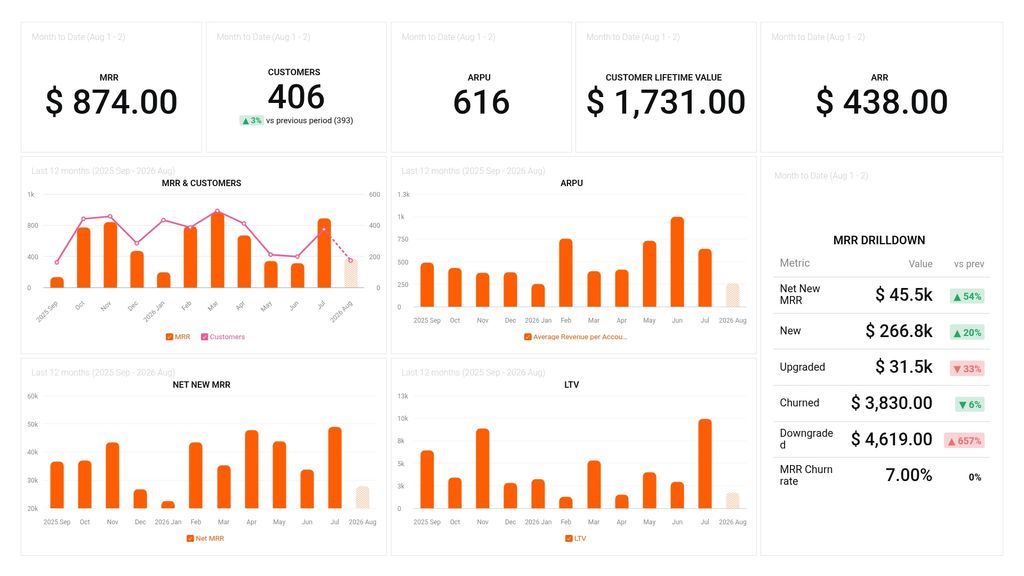
Try this dashboard for freeWhat you’ll learn from this Stripe SaaS Key Revenue Metrics for Decision-makers Dashboard Template:
Connect your Stripe account and learn:
- How do you monitor average revenue per user? While user LTV will tell you the value of a user over their entire life cycle, average revenue per user measures it over a set period of time. And by carefully monitoring it you will be able to see any anomalies and act on time to prevent them from recurring.
- How many customers do you have month over month? Keep track of your paying customers anytime, anywhere.Compare this data to the same time period in the previous week/month/year. Are you gaining enough customers to keep your pipeline full? And how is this affecting your MRR
- How do you track our monthly recurring revenue? View the total amount of revenue you expect to make regularly. Monitor your business’ health and growth by keeping an eye on the following metrics: New MRR, upgrades, downgrades, revenue churn, and so much more.
- How do you track customer lifetime value? This metric shows you the total net profit a company can expect to generate from a customer throughout their entire relationship. And it is important to see it trending up, and if its not discover what are the possible causes.
- How many customers do you currently have? Measure your customer retention rate by tracking how many customers you have.
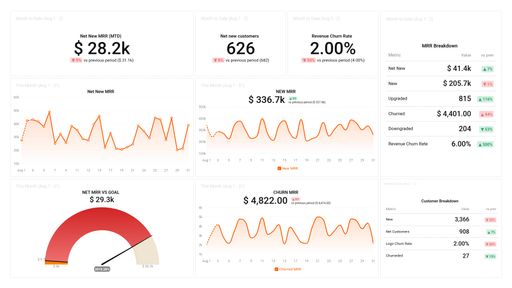
- Understand your MRR numbers better? Get deeper insights into your MRR by tracking metrics like Net New MRR, New, Upgraded, Churned, Downgraded and more
Pull additional data using our deep integration with Stripe
What else can you track and visualize with our robust integration with Stripe? When it comes to your most important payment metrics, churn, etc, almost anything:
- Gross and Net volume
- Customer retention rate
- SEO results
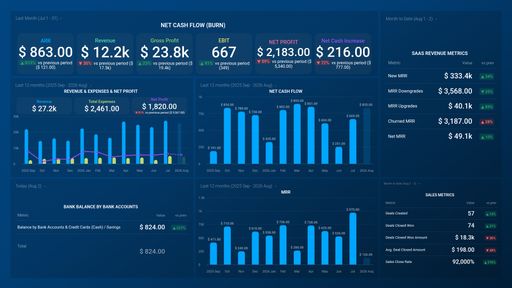
- Cash flow
- Conversion rate
There are many, many different metrics and metric combinations you can track using Stripe. And in Databox, you can quickly visualize dozens of Stripe metrics & KPIs in a variety of ways, alongside all the important metrics from other data sources you’re using.
Read more about Databox’s Stripe integration.
Explore more Stripe dashboards.
Stripe metrics included in this template
- LTV
-
MRR Downgrades
MRR downgrades is a metric that measures the decrease in monthly recurring revenue due to the downgrading of subscription plans by customers.
- Average Revenue per Account (Stripe)
-
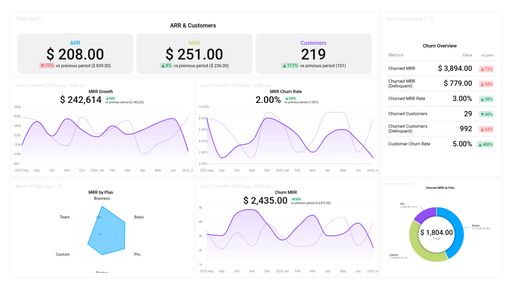
ARR
ARR stands for Annual Recurring Revenue, a metric that calculates the total amount of revenue a SaaS company generates from its recurring subscription fees in a given year. It's a key metric to measure the growth and predict the future revenue of a SaaS business.
-
Customers
Customers metric reflects the total number of unique customer accounts that have made transactions through Stripe.
-
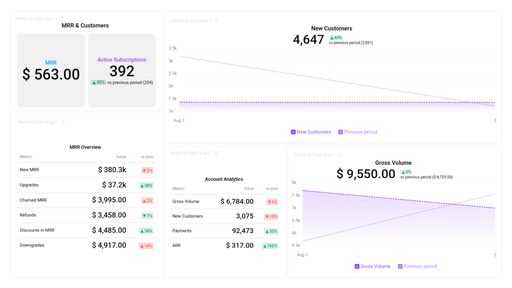
MRR
MRR (Monthly Recurring Revenue) is a metric that shows the predictable monthly revenue generated by a subscription-based business model. It includes all recurring charges and allows businesses to monitor customer retention and growth.
-
MRR Upgrades
MRR Upgrades measures the total increase in Monthly Recurring Revenue (MRR) from existing customers who upgraded to a higher-priced subscription plan.