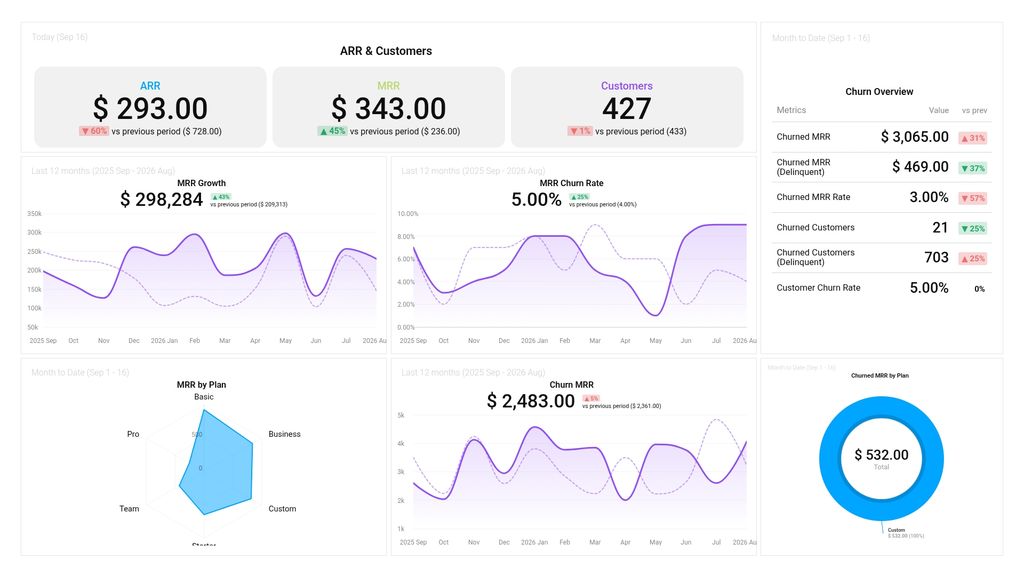
What you’ll learn from this Stripe (MRR & Churn) Dashboard Template:
Connect your Stripe account and learn:
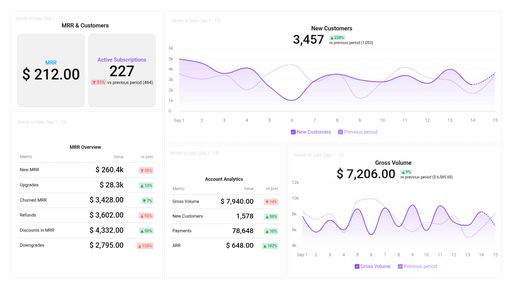
- How much did I make in sales today? Track the total sales value yielded from the products and services you sold within a specified time period. It is important to note that your gross volume is how much you received in sales before deductions, such as discounts, refunds, disputes, fees, etc.
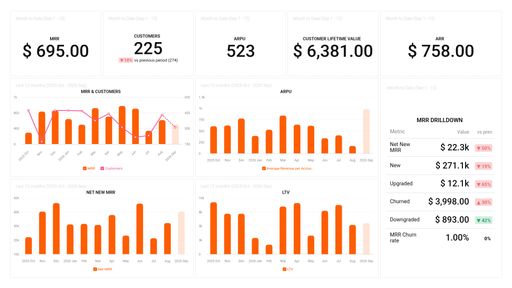
- How do I track my Monthly Recurring Revenue (MRR) over time? Evaluate how fast your company is growing based on the total monthly revenue generated from all recurring subscriptions. Analyze long-term trends in MRR and not just singular events, to better inform your revenue forecasting, and assessment of the financial health of your business.
- How many customers do we currently have? View the total number of clients your company has at any given point in time. Staying on top of your customer count is important, as it lets you know if your customer base is growing or declining in number.
- What percentage of my customers churned last month? Measure the percentage of customers or subscribers you lost (customers that canceled or didn’t renew their subscription/payment) during a given time period. Although users churn for various reasons,it helps to compare how your churn rate varies over different time frames, and to also examine the behavioral patterns of churned customers, in order to uncover unique trends and possibly reduce your churn rate over time.
- How much in revenue did I lose from churned customers? See how much in monthly recurring revenue your company lost as a result of customers that churned or downgraded their subscriptions. Your revenue churn rate is a good indicator of your company’s growth in terms of retention and upselling.
Pull additional data using our deep integration with Stripe.
What else can you track and visualize with our robust integration with Stripe? When it comes to your most important payment metrics, churn, etc., almost anything:
- Gross and Net volume
- Customer retention rate
- Cash flow
- Conversion rate
There are numerous metrics and metric combinations you can track using Stripe. And in Databox, you can quickly visualize dozens of Stripe metrics & KPIs in a variety of ways, alongside all the important metrics from other data sources you’re using.
Read more about Databox’s Stripe integration.