Uses one-click integrations:
-
 Stripe
If you don't use Stripe, you can pull data from any of our 130+ one-click, native integrations or from spreadsheets, databases and other APIs.
Try this dashboard for freeWhat you’ll learn from this Stripe Dashboard Template:
Connect your Stripe account and learn:
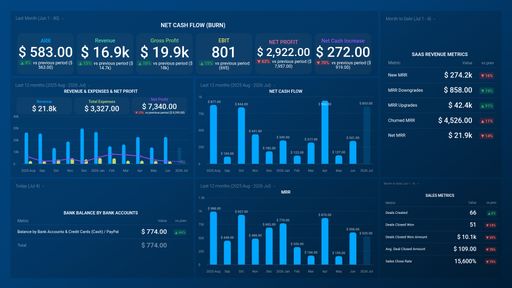
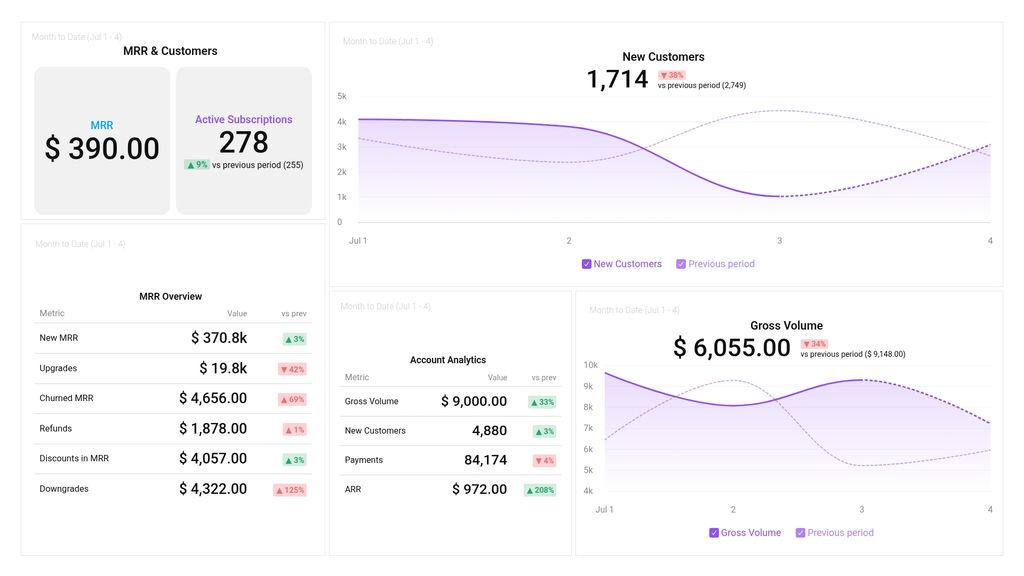
- How do we monitor all received payments? Find out how much all payment transactions are worth, including fees, refunds, discounts, and so on. See how the total dollar amount of received payment transactions for the current time period compares to previous periods.
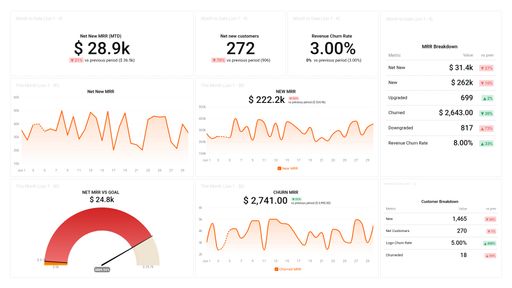
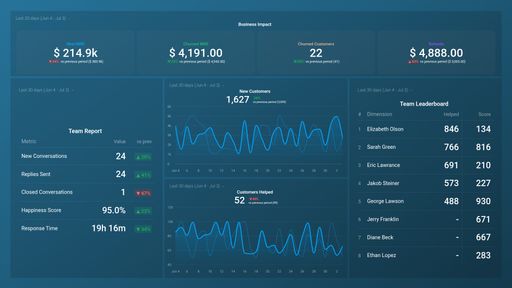
- How many new customers signed up last month? Keep track of your new paying customers anytime, anywhere. See how many people have newly signed up to make a purchase or tried your product or service. Compare this data to the same time period in the previous week/month/year. Are you gaining enough customers to keep your pipeline full?
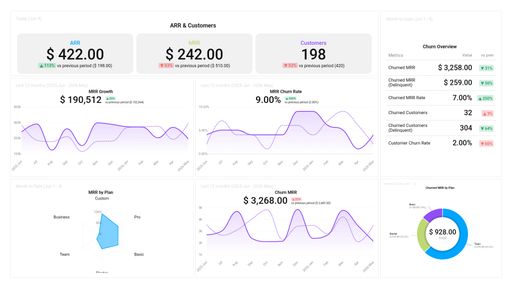
- How do we track our monthly recurring revenue? View the total amount of revenue you expect to make regularly. Monitor your business’ health and growth by keeping an eye on the following metrics: New MRR, upgrades, downgrades, revenue churn, and so much more.
- How do we track and manage our active subscriptions? See the total number of active subscriptions you have at any given point in time.
- How many customers do we currently have? Measure your customer retention rate by tracking how many customers you have.
- Which is the most popular subscription plan? Effortlessly track the subscription plans of your new customers. Discover which plan has the most subscriptions and why. Use this data to improve your upgrade program and pricing plans if need be.
Pull additional data using our deep integration with Stripe
What else can you track and visualize with our robust integration with Stripe? When it comes to your most important payment metrics, churn, etc, almost anything:
-
- Gross and Net volume
- Customer retention rate
- SEO results
- Cash flow
- Conversion rate
There are many, many different metrics and metric combinations you can track using Stripe. And in Databox, you can quickly visualize dozens of Stripe metrics & KPIs in a variety of ways, alongside all the important metrics from other data sources you’re using.
Read more about Databox’s Stripe integration.
Explore more Stripe dashboards.
Stripe metrics included in this template
-
Payments
Payments metric refers to the number of successful transactions processed by a business or organization using Stripe payment processing technology. It provides insight into revenue, customer buying behavior, and financial performance.
-
Gross Volume
Gross Volume measures a company's total transaction value, incl. revenue, fees, taxes, and refunds. Key for growth, pricing, and data-driven decisions.
-
Discounts (excl. Canceled Subscriptions)
Discounts (excl. Canceled Subscriptions) is a metric that reflects the total revenue reduction due to discounts applied to monthly recurring revenue (MRR) of a business through Stripe.
-
Active Subscriptions
Active Subscriptions metric refers to the number of recurring payment plans that currently have an active or past due status.