Uses one-click integrations:
-
 QuickBooks
If you don't use QuickBooks, you can pull data from any of our 130+ one-click, native integrations or from spreadsheets, databases and other APIs.
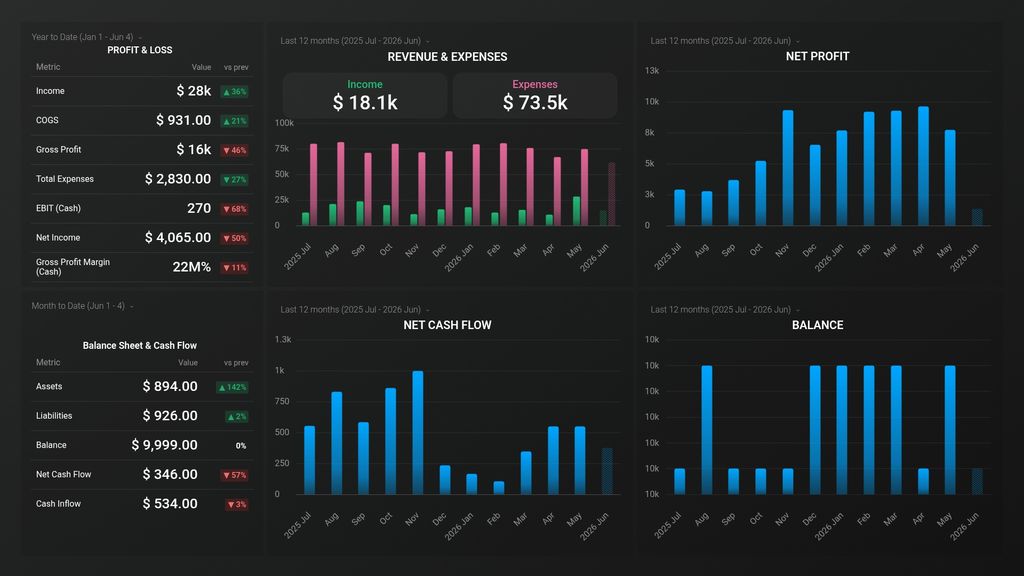
Try this dashboard for freeWhat you’ll learn from this QuickBooks Financials Overview Dashboard Template
Connect your Quickbooks account, and you can learn the following:
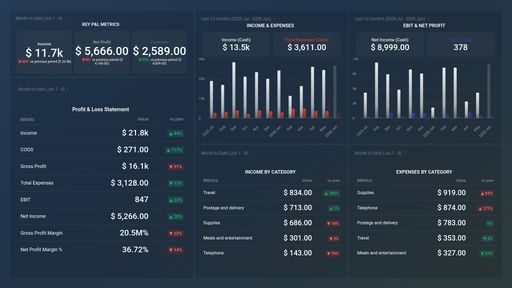
- How to keep track of your profit and loss? By keeping an eye in real-time on your main profit and loss metrics, you will be able to see any major changes that happen during a week, month, or quarter, and this will help you take action that can help reduce some major issues that might come up.
- How to view a clear comparison of your revenue and expenses? By seeing your revenue and expenses side by side, you can easily detect if there is a major change in one or both of these metrics. Ideally, your revenue should be significantly higher than your expenses, but if there are any sudden or visible changes, you can easily detect them and take steps to find the cause and remove them.
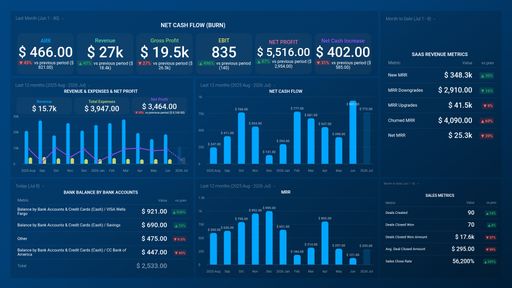
- How to track net profit and net cash flow? Net profit is a profitability measure that tells you how much money your business made during the period after accounting for your expenses. While net cash flow is a profitability metric that represents the amount of money produced or lost by a business during a given period. By regularly tracking these two metrics you can see how well your business is doing in real time - the higher the net income, the better the profit and the more efficient your business is operating.
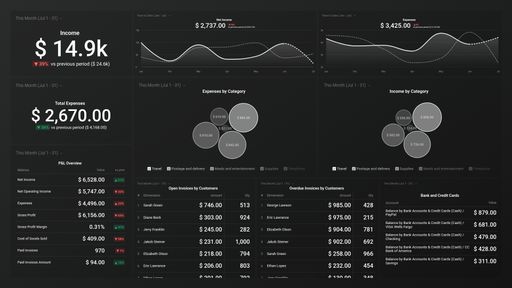
- How do I track my expenses? Track and manage your business expenses daily, weekly, and monthly by category. Tracking your business expenses helps you see exactly where your money goes. It also helps cut down on wasteful spending and be better prepared for tax season.
Pull additional data using our robust integration with Quickbooks.
What other financial metrics can you track and visualize with our integration with Quickbooks? Almost anything:
- Cash flow forecast
- Customer balance
- Income & Sales by customer
- Purchases by vendors
- Inventory valuation
- Budget & forecasting
In Databox, there are dozens of Quickbooks metrics already built and ready for you to visualize in a variety of different ways. With Metric Builder and Data Calculations, the range of different metrics and metric combinations you can track from Quickbooks widens.
Read more about Databox’s Quickbooks integration.
Explore more QuickBooks dashboards.
QuickBooks metrics included in this template
- Gross Profit Margin (Cash)
-
EBIT (Cash)
EBIT (Cash) reflects a company's earnings before interest and taxes, derived from cash transactions. It's determined by subtracting operating expenses from gross profit.
-
Money Received
Money Received is a financial metric in QuickBooks that represents the total amount of money received from customers or clients for goods or services sold within a given period of time. It helps businesses to track their sales revenue and cash flow accurately.