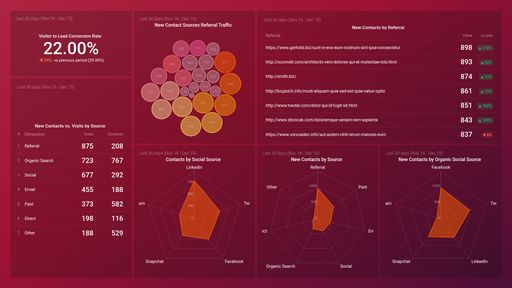
HubSpot Marketing Conversion Drilldown Dashboard Template

Template created by Databox Databox
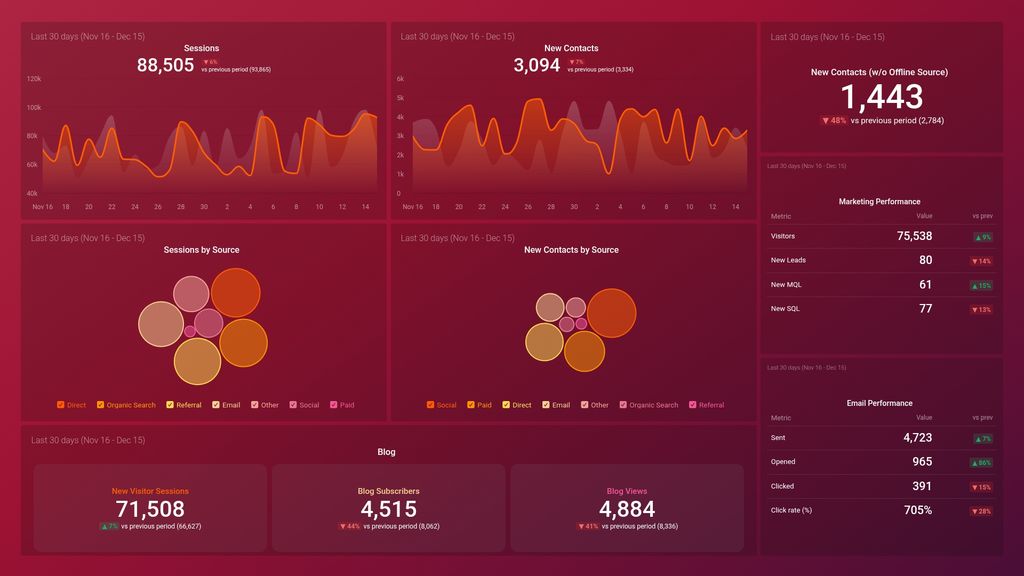
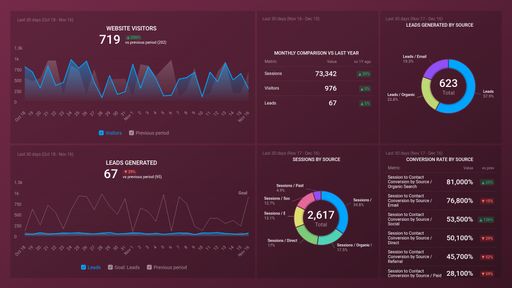
With this free HubSpot Marketing Conversion Drilldown Dashboard Template, you’ll be able to see at a glance which marketing activities and channels drive the most conversions for your business. Use this immensely valuable dashboard template to improve your marketing strategy and determine which channels are worth investing resources in.

Uses one-click integrations:

  • HubSpot Marketing HubSpot Marketing

If you don’t use HubSpot Marketing, you can pull data from any of our 100+ one-click, native integrations or from spreadsheets, databases and other APIs.

Get this dashboard for free

What you’ll learn from this HubSpot Marketing Conversion Drilldown Dashboard Template

Connect your HubSpot Marketing account and learn:

  • How do I track user actions throughout my website? Get a complete overview of how users journey through your funnel. Visually monitor the exact stage in your conversion funnel where users spend the most time and where they drop off the most. Also, see how many users are going through each stage of the funnel at any point in time.

    Use this data to optimize your website and user experience to ensure your website visitors carry out the desired action.

  • What percentage of my site visitors end up converting to new contacts? See what percentage of your website visitors eventually become new contacts (fill out a form, download an ebook, sign up to your mailing list, etc.) within a given time period. If your session to contact rate is high, it is an indicator that your landing page and CTAs are well optimized for conversions.
  • What percentage of my leads end up converting to customers? See what percentage of your contacts end up converting to paying customers within a selected time frame. Your contacts to customer rate is a great way to measure your sales team’s effectiveness in converting qualified leads to customers.
  • How do I track landing page conversions? Track the number of users who visit your landing page daily and carry out the desired action, such as filling out a form, downloading an ebook, signing up to your mailing list, etc.

    This data is necessary to track as it lets you know if your landing page is well optimized for conversions.

  • Which channels generate the most leads for your business?Identify your best-performing marketing channels in generating leads for your business. See how many visitors end up becoming contacts via these channels (paid social, email marketing, referrals, organic search, direct traffic, and so on). It is important to track this data in order to learn where to invest most of your resources for increased conversions.
  • Which blog posts drive the most conversions? Find out which blog posts drive the most conversions for your business, i.e., the blog posts wherein users end up completing the desired action (such as filling out a form, downloading an ebook, signing up to your mailing list, and so on).
  • Which landing pages generate most new contacts? Monitor the performance of your landing pages at a glance. See which landing pages drive the most conversions, i.e., get website visitors to convert to the next stage in the buyer's journey.

Pull additional data using our deep integration with HubSpot Marketing

What else can you track and visualize with our deep integration with HubSpot Marketing? When it comes to traffic and conversions, almost anything:

  • Website traffic and conversions
  • Traffic and lead demographics
  • Landing page performance
  • The conversion rate(s) throughout your marketing and sales funnel(s)
  • Track and compare the efficiency of your marketing campaigns
  • Monitor campaign improvements and growth over time

There are numerous metrics and metric combinations you can track using HubSpot Marketing. In Databox, you can quickly visualize 100s of HubSpot metrics in various ways.

Read more about Databox’s HubSpot Marketing integration.

HubSpot Marketing HubSpot Marketing metrics included in this template
  • Customer Conversion Rate

    The Customer Conversion Rate metric measures the percentage of website visitors or leads that convert into paying customers, indicating the effectiveness of a company's marketing and sales efforts.

  • New Contacts

    New Contacts metric tracks how many new leads or contacts have been added to your Hubspot database within a specific time frame, often daily, weekly, or monthly.

  • New Contacts by Email Marketing Source

    The New Contacts by Email Marketing Source is a metric in Hubspot that indicates the number of new contacts that have been acquired through email marketing campaigns. This metric allows marketers to analyze the effectiveness of their email campaigns in generating leads.

  • New Contacts by Landing Page

  • Became a Customer

  • Became a SQL

  • New Contacts by Blog Post

Customize dashboard
Explore all of Databox’s functionalities:

Customize this dashboard with Databox

Sometimes, you’ll want to dive deeper into performance. When you need to customize this template (or any other dashboard) to include different metrics, add metrics from different sources, etc., you can do so by using Databox’s Dashboard Designer.

The Designer allows you to easily drag-and-drop metrics and visualizations from any data source right into your dashboard.

Get Started