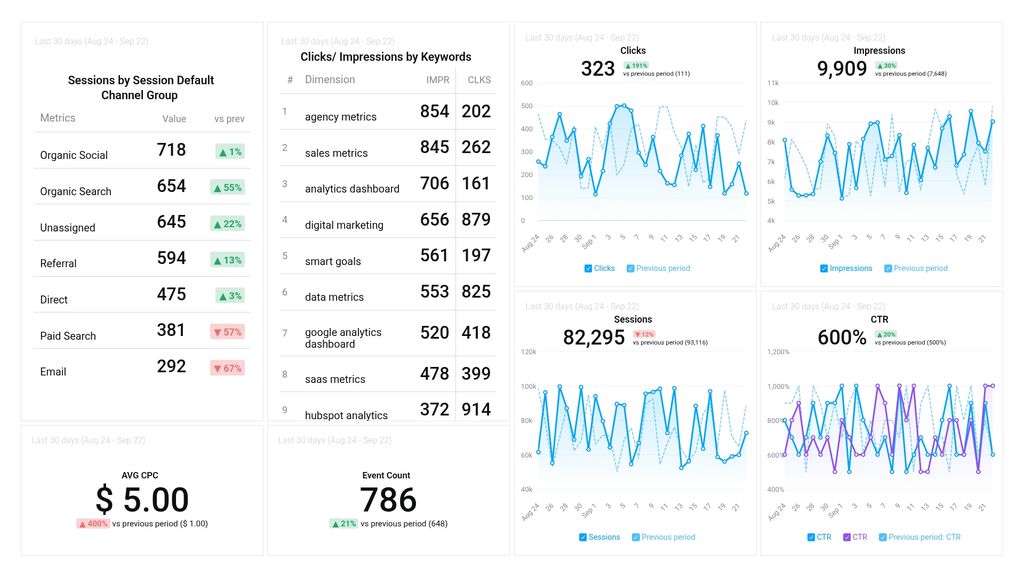
What you’ll learn from this GA4 & Google Ads & Performance Report Dashboard Template
Simply connect your Google Ads and GA4 accounts, and you’ll learn:
- Which metrics should I be tracking for my Google Ads campaigns? Measure the effectiveness of your Google ads campaign by tracking key metrics such as how many people saw your ad, and clicked on it, as well as your click-through rate (CTR), average cost per click (CPC), conversions, and so on. By tracking these metricsusing a GA 4 & Google Ads report template , you’ll be able to measure your actual results against your goals and ROI to determine what to prioritize, change, or optimize regarding your ad strategy.
- How do I measure the click-through rate for all my ad groups? See the percentage of impressions that resulted in clicks for each ad group that makes up your existing campaigns. Find out how many people actually clicked on your ad; this is a good indicator of your ad’s relevance.
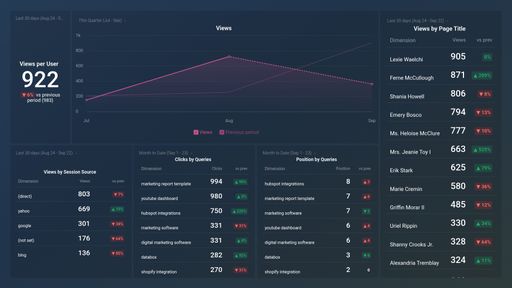
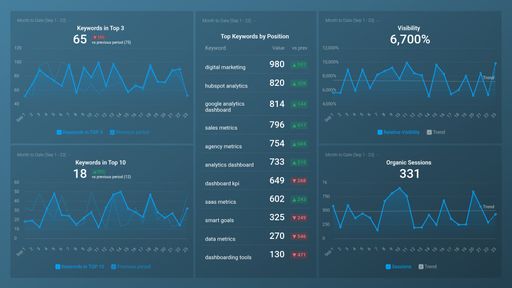
- How do I track keyword-level clicks on my ads? Track the performance of specific keywords for your Google Ads campaigns. View the number of clicks that resulted from these keywords in a month as well as CTR. A high CTR indicates to Google that you’re useful to people searching online using those specific keywords.
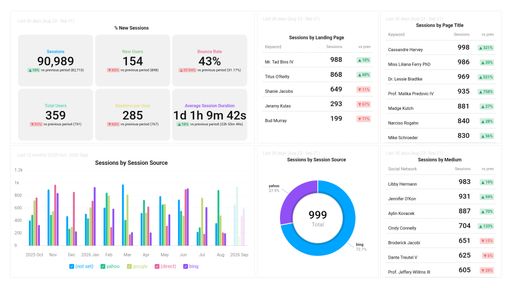
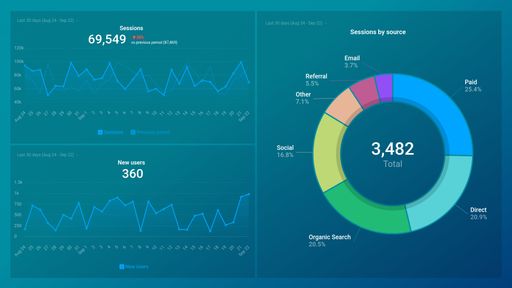
- Which channel brings in the most sessions? Identify the specific channels that bring in the most sessions to your website. This will help you focus your efforts where you are most likely to see an ROI when it comes to increasing the number of sessions.
What else can you track and visualize with our deep integration with Google Ads and GA4?
When it comes to attributing your to traffic and conversions, almost anything:
- Impressions, clicks, and conversions
- Cost analysis
- Keyword analysis
- Conversion analysis
- Paid advertising
- Landing page performance
- Engagement by Ad, Ad Group, and Ad Campaign, and more
- Website Engagement
There are numerous metrics and metric combinations you can track using Google Ads and GA4. And in Databox, you can quickly visualize dozens of Google Ads metrics in a variety of ways.
Read more about Databox’s Google Ads and GA4 integrations.