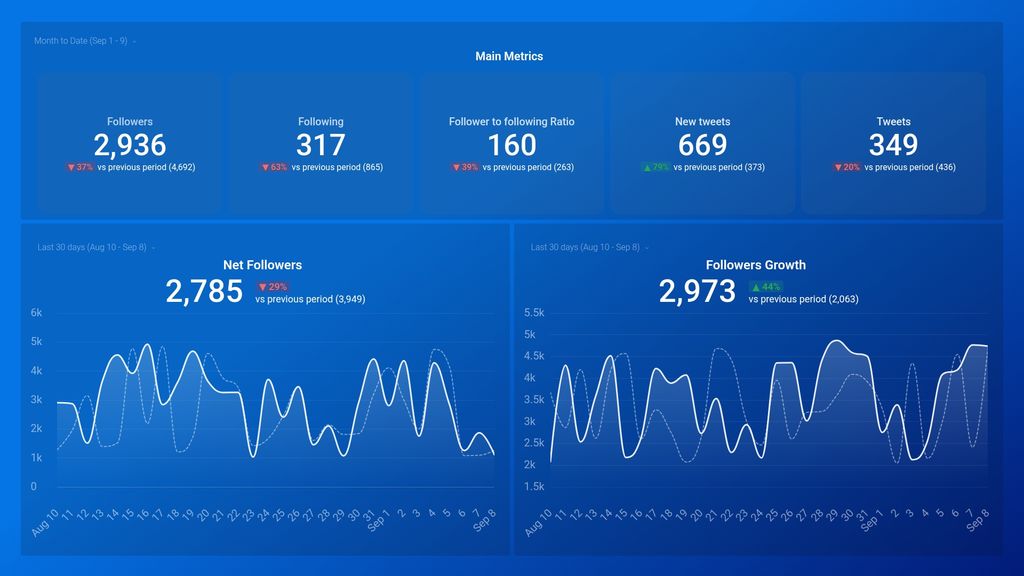
What you’ll learn from this Twitter (Growth & Engagement) Dashboard template:
Download this dashboard template to measure and track your most relevant Twitter engagement metrics. Use the insights gained to determine your best performing content, the best time to post, and measure followers’ growth and ROI. Simply connect your Twitter account, and you’ll learn:
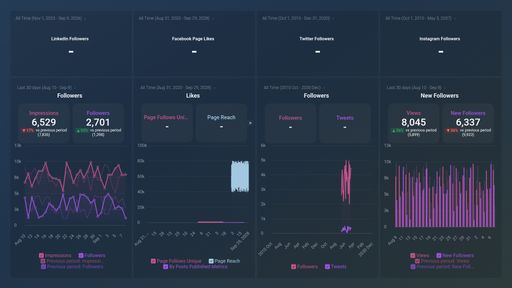
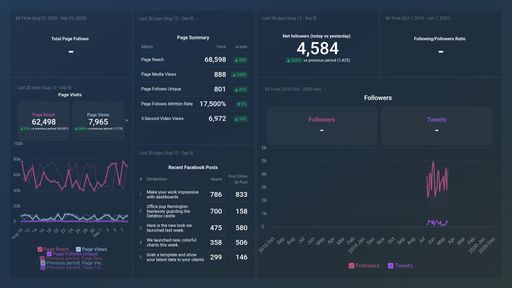
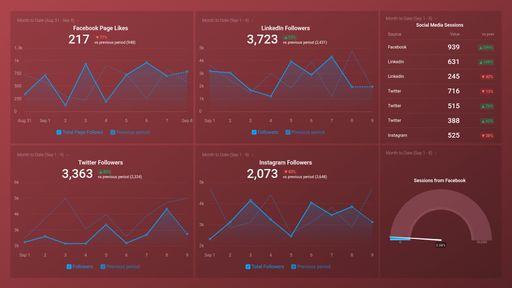
- How do I track my Twitter follower growth? View the total number of followers you have on Twitter. Visually monitor how many followers you gain or lose on a daily basis. Can your loss of followers be attributed to certain content or action? Use this information to optimize your followers’ acquisition strategy.
- How engaged are my Twitter followers? View how many times people interacted with your tweets within a time period by tracking key metrics, such as retweets, replies, and likes. By tracking this metric, you’ll be able to find out which content generates the most engagement.
- How do I track my Twitter mentions? View how many times your brand was mentioned on Twitter in a day, week, or month. This is a good indicator of your brand’s popularity. Pay attention to this metric if you’re interested in finding out what kind of topics your brand gets mentioned in and where your Twitter mentions are coming from.
- How many times did I tweet this month? Get a real-time count of the total number of tweets you’ve put out within a period of time.
- How do I measure my Twitter activity? View and measure your Twitter activity at any given point in time. Visually monitor how people engage with your tweets in real-time. By using this data, you’ll be able to identify your best-performing tweets based on the spikes or drops overtime.
- What’s my follower to following ratio? View your follower to following ratio at any point in time. Use this metric to evaluate the quality of your account. How many followers do you have, compared to the number of people you’re following? If you follow way more people than you have following you back, it’s an indication you need to rework your content’s relevance and authenticity.
Pull additional data using our robust integration with Twitter.
-
- Engagement Rate
- Profile and Link Clicks
- Average Tweet Performance
- Audience Tweet Demographics
- Video views
- Impressions
And so on...
Read more about Databox’s Twitter integration.