DataboxDatabox Databox

SEMrush Errors

The Errors metric in SEMrush shows the number of technical website issues detected during a site audit. These errors can negatively affect site performance and should be fixed to improve overall SEO health.

With Databox you can track all your metrics from various data sources in one place.

Errors 2.190,879 Start tracking this metric
  • About
  • Tech details
What is "Errors"?
The Errors metric in SEMrush represents the number of HTTP status codes that indicate that your website could not be reached or accessed by search engines or users. These errors can negatively impact your website's SEO performance and lead to a decrease in visibility and traffic. Monitoring and fixing these errors regularly can help improve your website's overall health and optimize its performance. SEMrush tracks Errors as part of its Site Audit tool, which scans your website for technical issues and provides recommendations for optimization.
Example: The Errors metric can help in identifying crawl errors on a website, such as broken links or HTTP status errors, enabling the user to take corrective actions.

Visualizations

  • Databox visualization

    Number

    Used to show a simple Metric or to draw attention to one key number.

How to track Errors in Databox?

Databox is a business analytics software that allows you to track and visualize your most important metrics from any data source in one centralized platform.

To track Errors using Databox, follow these steps:

  1. 1
    Connect SEMrush that contains the metric you want to track
  2. 2
    Select the metric you want to track from the list of available metrics
  3. 3
    Drag and drop the selected metric onto your dashboard
  4. 4
    Watch your dashboard populate in seconds
  5. 5
    Put Errors on the Performance screen
  6. 6
    Get Errors performance daily with Scorecards or as a weekly digest
  7. 7
    Set Goals to track and improve performance of Errors
SEMrush integration with Databox Track Errors from SEMrush in Databox GET STARTED

SEMrush Errors included in Dashboard Templates 2

  • Live view

    Semrush Keywords & Audits

    Semrush (Keywords and Audits) dashboard template gives you a full view of your SEO visibility as well as any errors that SERPS might face

    SEMrush
  • Live view

    Semrush Site Audit

    Stay on top of any errors, warnings and notices that are slowing down your site.

    SEMrush

SEMrush Errors included in Report Templates 2

  • Details

    SEO Performance Report Template

    Unlock the power of your SEO strategy with this SEO Performance report. Track vital metrics like keyword visibility, traffic growth, and site health effortlessly. Perfect for keeping stakeholders informed and your SEO efforts on target.

    SEMrush Google Search Console Ahrefs
  • Details

    Semrush Report Template

    Use this Semrush report to share important SEO insights like position tracking, keyword rankings, site audit health, and more.

    SEMrush

Basics

  • Description
    The Errors metric in SEMrush shows the number of technical website issues detected during a site audit. These errors can negatively affect site performance and should be fixed to improve overall SEO health.
  • Category
    SEO
  • Date Added
    2017-04-05
  • Cumulative Support
    No
  • Units
    No
  • Granularities
    daily, weekly, monthly, yearly, quarterly, allTime
  • Favorable Trend
    decreasing
  • Historical Data
    No
  • Changing historical data
    No
  • Forecast Support
    Yes
  • Benchmark Support
    Yes
  • Media Support
    No
  • Dimension
    N/A
  • Metric Type
    current Learn more
  • API Endpoint
    https://oauth.semrush.com/api/v1/databox/site_audit/{project}

Track all of your key business metrics from one screen

GET STARTED
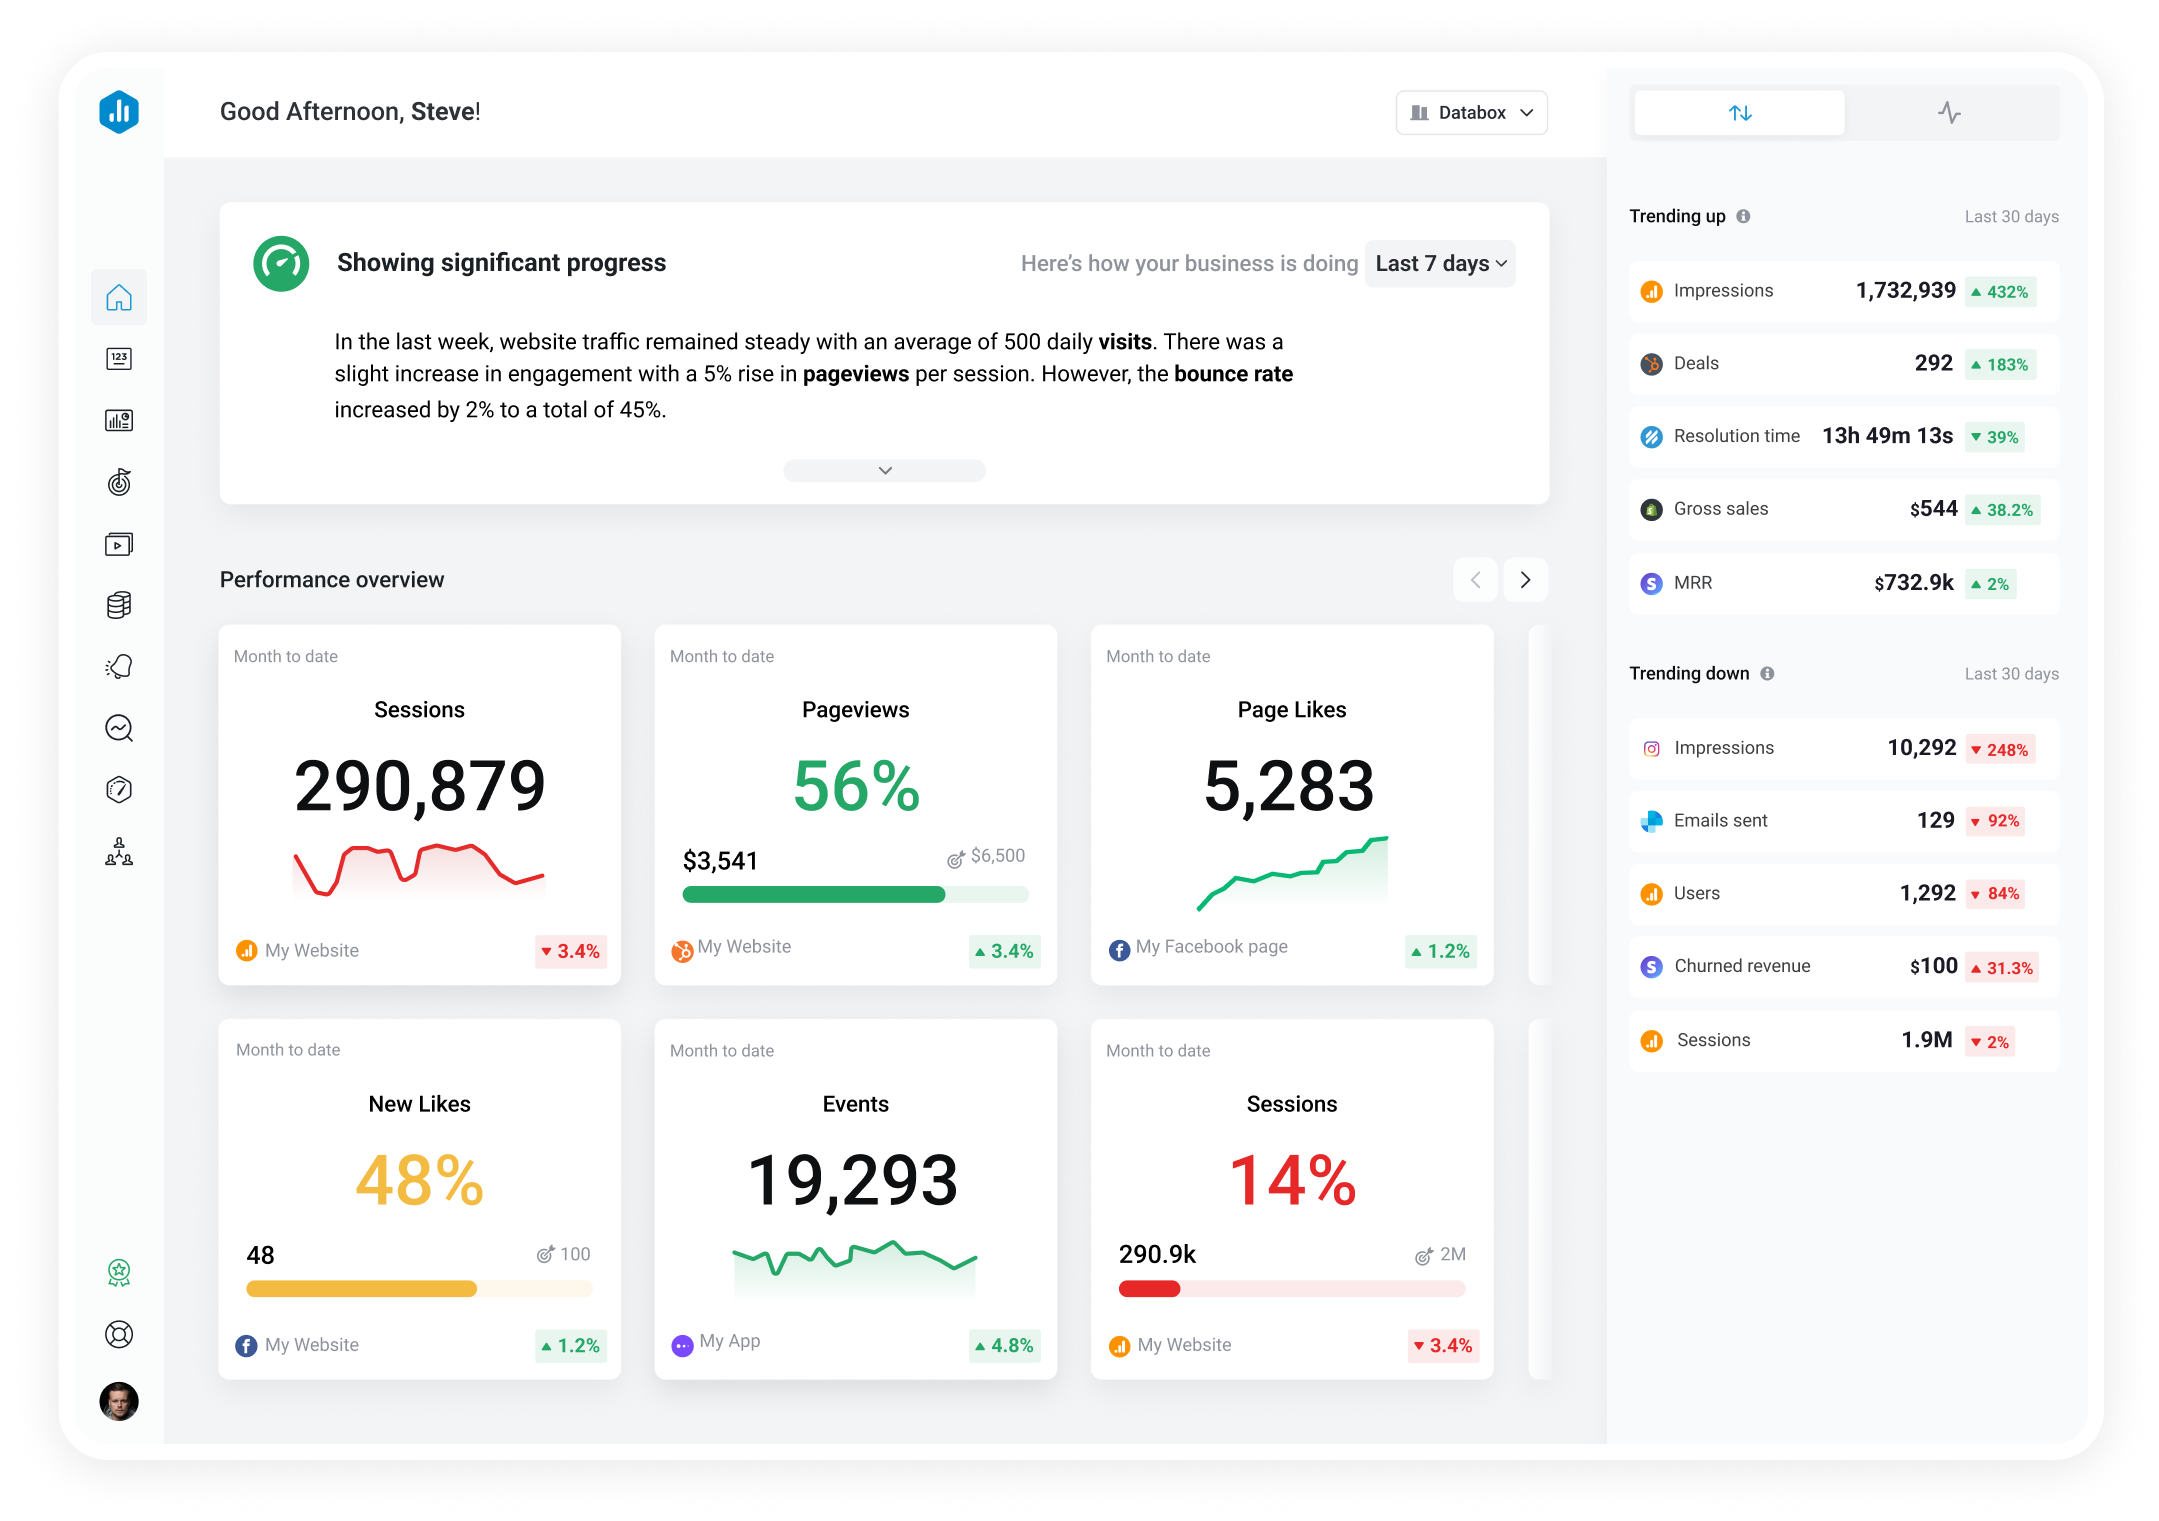
Databox app preview