Uses one-click integrations:
-
 YouTube
If you don't use YouTube, you can pull data from any of our 130+ one-click, native integrations or from spreadsheets, databases and other APIs.
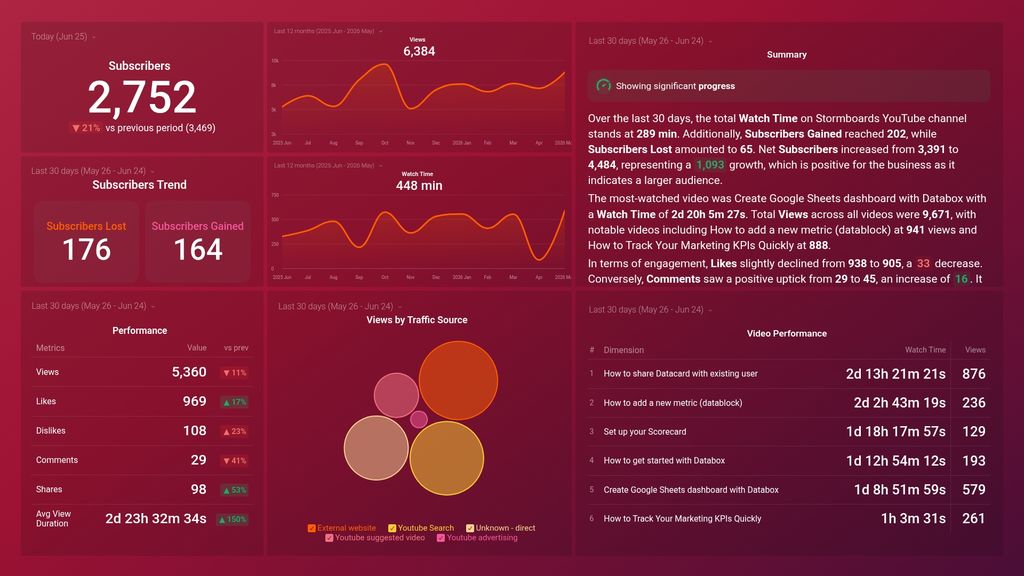
Try this dashboard for freeWhat you’ll learn from this YouTube Channel Performance Dashboard Template:
Connect your YouTube account and learn:
-
- How can I track my subscriber rate? Track the number of subscribers you have gained or lost in total from the beginning of the month till date. It is essential to track your subscriber rate as the more subscribers you have, the more likely your videos will be seen by your subscribers.
- How much time do my viewers spend watching my video content? View the total amount of minutes viewers spent watching your YouTube videos daily, weekly, or monthly. By monitoring key trends in your videos’ watch time, you’ll be able to act promptly on your video strategy and its relevance once you spot a continuous drop.
- Which videos drive most of your watch time for the month? Learn about your most engaging videos based on the total amount of time they spent watching them. This is a great way to measure how relevant and engaging your videos are. If the watch time of certain videos is low, it means you have to change or optimize key aspects of your video content.
- How quickly are you gaining subscribers? Get useful, actionable data on how your subscribers’ list is growing on a daily basis. See how many people have subscribed or unsubscribed from your channel in real-time. Are you losing more subscribers than you’re gaining? This is a good measure of the health of your channel.
- How do I measure audience engagement? Are you creating the kind of content your viewers will be willing to share, like, and comment on? Find out by tracking how your viewers interact with your video content on a daily basis; track the number of likes, comments and shares you’ve received over time. This is a good way to measure audience engagement and user feedback.
Pull additional data using our deep integration with YouTube.
What other YouTube metrics can you track and visualize with our integration with YouTube?
- Identify your traffic sources
- Learn audience demographics
- Viewer retention
- Subscriber count
- Video engagement
- YouTube referrals, and more.
There are numerous metrics and metric combinations you can track using YouTube. And in Databox, you can quickly visualize dozens of YouTube metrics in a variety of different ways.
Read more about Databox’s YouTube integration.
Explore more Youtube dashboards.
YouTube metrics included in this template
-
Average View Duration
Average View Duration measures the average length of time viewers watched a video before leaving. It helps creators determine the level of audience engagement with their content.
-
Comments
The Comments metric represents the number of comments left by viewers on a YouTube video. It is an important engagement metric that indicates how viewers are interacting with the content and can help creators understand how their audience is responding to their videos.
-
Dislikes
Dislikes are a metric on YouTube that represents the number of viewers who have given a thumb down to a particular video. This metric is used to measure the level of audience engagement and can influence the algorithm's recommendation of the video to other users.
-
Watch Time
Watch Time is the total amount of time viewers spend watching a video on YouTube, from start to finish. It's a crucial metric for creators, as it directly impacts video ranking and monetization potential.
-
Watch Time by Video
Watch Time by Video is a metric that measures the total amount of time viewers have spent watching a particular YouTube video, which is a key factor in determining the overall success and popularity of a video on the platform.
-
Subscribers Lost
The Subscribers Lost metric measures the total number of subscribers who have unsubscribed from a channel during a specific time period. It indicates the decrease in the audience size and can be used to analyze the reasons for the loss of subscribers.
-
Views by Traffic Source
Views by Traffic Source metric shows the number of views generated by each source such as YouTube search, suggested videos, external websites, etc. It helps to understand which traffic sources are driving more views to your videos.