Uses one-click integrations:
-
 ProfitWell
If you don't use ProfitWell, you can pull data from any of our 130+ one-click, native integrations or from spreadsheets, databases and other APIs.
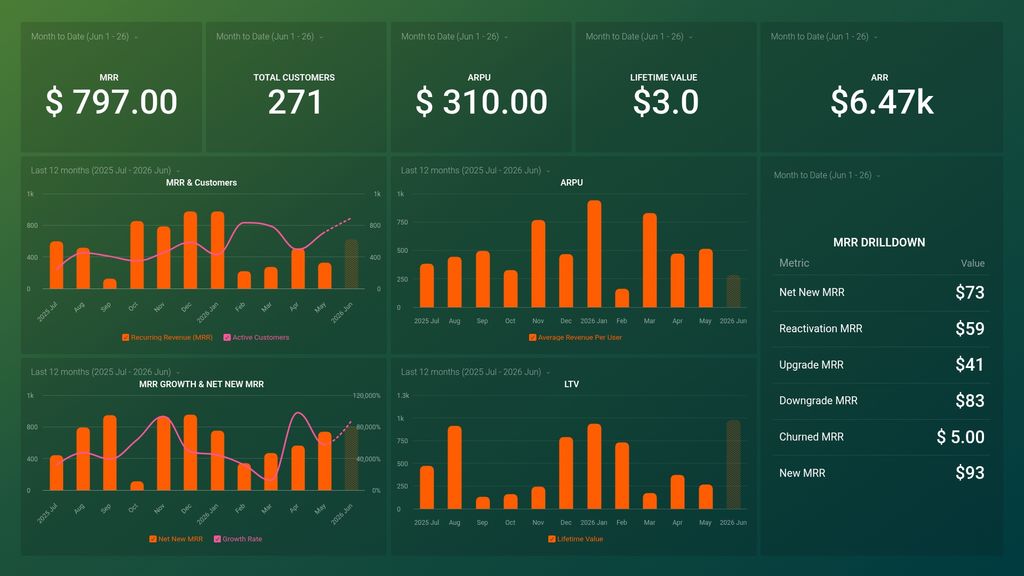
Try this dashboard for freeWhat you’ll learn from this SaaS Revenue Breakdown for Leadership - Profitwell Dashboard Template
Get quick updates on your revenue reporting KPIs without hassle. Connect your Profitwell account and learn:
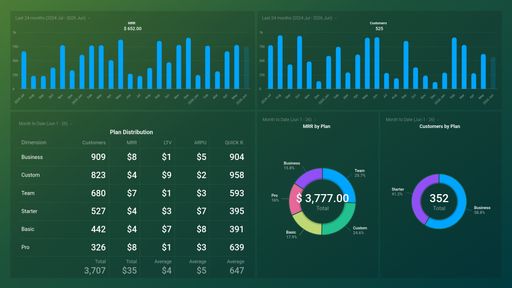
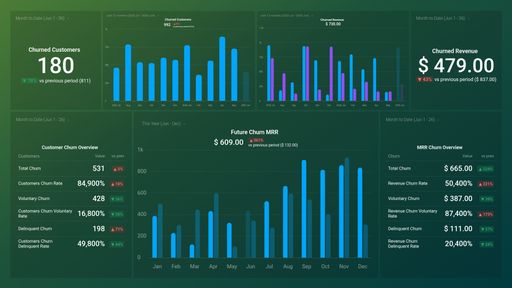
- How do you track your monthly recurring revenue? View the total amount of revenue you expect to make regularly. Monitor your business’ health and growth by keeping an eye on the following metrics: New MRR, upgrades, downgrades, revenue churn, and so much more.
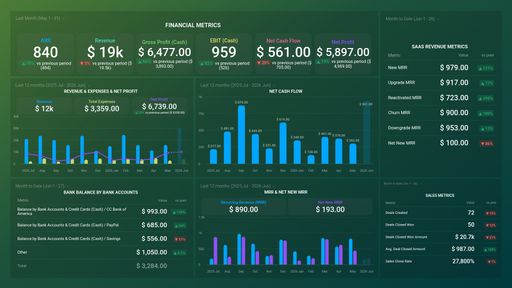
- How do you keep track of your annual recurring revenue? ARR plays an instrumental role in measuring the momentum of your business and forecasting future growth. With this vital information, you can actively work toward achieving your goals and dominating the industry.
- How many customers do you have month over month? Keep track of your paying customers anytime, anywhere.Compare this data to the same time period in the previous week/month/year. Are you gaining enough customers to keep your pipeline full? And how is this affecting your MRR
- How do you track customer lifetime value? This metric shows you the total net profit a company can expect to generate from a customer throughout their entire relationship. And it is important to see it trending up, and if its not discover what are the possible causes.
Pull additional data using our deep integration with Profitwell
What other campaign metrics can you track and visualize with our Profitwell integration? Among others:
- Cash flow & Cash balance
- Accounts receivable and payable
- Consolidated net income
- Net sales
- Gross profit margin
- Top customers, vendors and products
There are many different metrics and metric combinations you can track using this integration. And in Databox, you can quickly visualize your most important financial metrics in various ways to help you create consolidated reports.
Read more about Databox’s Profitwell integration.
ProfitWell metrics included in this template
-
Active Customers
Active Customers is a metric that measures the total number of customers that have engaged in a paid transaction with a business during a given period of time.
-
Average Revenue Per User
ARPU is the measure of monthly or annual revenue generated by a single customer. It helps to understand the overall performance of a subscription business by tracking revenue trends.
-
Growth Rate
Growth Rate is the percentage increase or decrease in revenue over a set time period, used to gauge the performance of a business and its ability to expand.
-
Lifetime Value
Lifetime Value (LTV) measures the total revenue a customer will bring to a business over their entire lifespan as a customer.
-
Recurring Revenue (MRR)
MRR is a crucial metric for subscription-based businesses that measures the predictable, recurring revenue generated from subscriptions each month.
- Annual Recurring Revenue (ARR)