Uses one-click integrations:
-
 ProfitWell
If you don't use ProfitWell, you can pull data from any of our 130+ one-click, native integrations or from spreadsheets, databases and other APIs.
Try this dashboard for freeWhat you’ll learn from this SaaS MRR Drilldown for Weekly Monitoring - Profitwell Dashboard Template
Get quick updates on your revenue reporting KPIs without hassle. Connect your Profitwell account and learn:
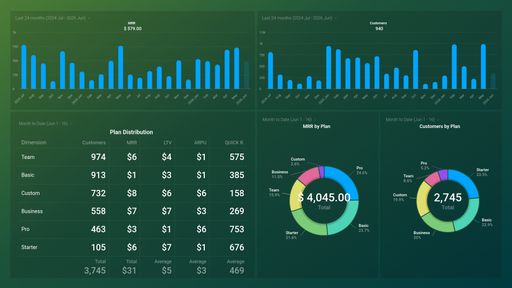
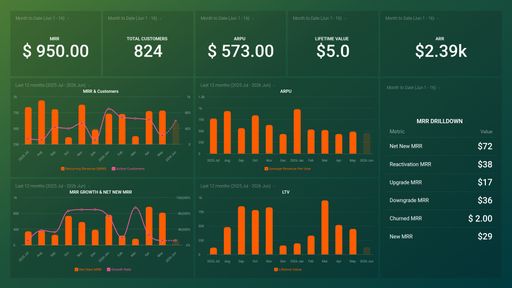
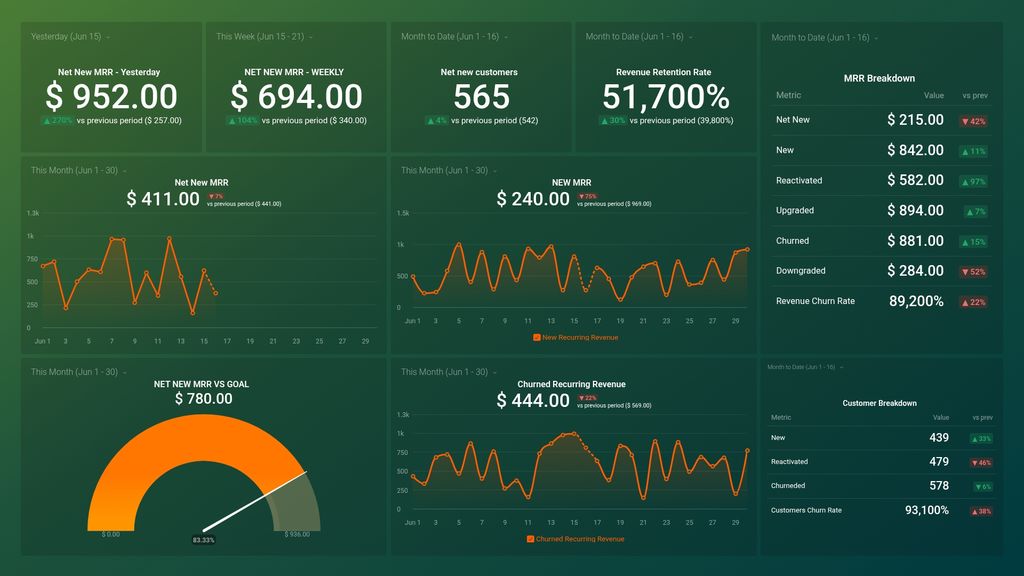
- How do you track your monthly recurring revenue? View the total amount of revenue you expect to make regularly. Monitor your business’ health and growth by keeping an eye on the following metrics: New MRR, upgrades, downgrades, revenue churn, and so much more.
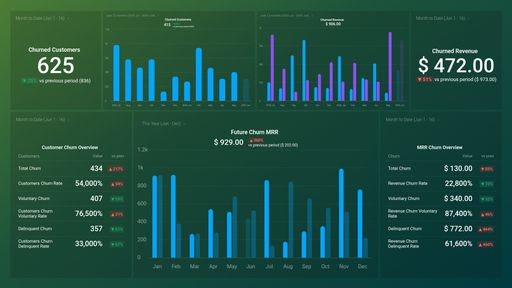
- How do you keep track of your churned MRR? For a SaaS company churned MRR is one of the biggest issues. Monitoring this metric can help you understand and forecast your business growth better. Also you will know when it is time to take action to reduce the churn if possible.
- Will you reach your New MRR Goal? Monitor your new MRR each month and compare it to the goal you have set. You will be easily able to see if there is a rising or declining pattern and take action accordingly.
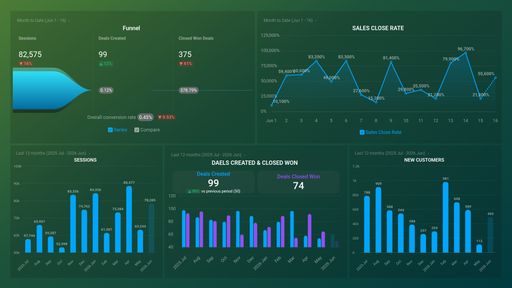
- How to understand your customers better? Keep track of your new paying customers anytime, anywhere. See how many people have newly signed up to make a purchase or tried your product or service. How many have churned? Is your churn rate up or down. All these metrics will help you make accurate decisions about your business growth.
Pull additional data using our deep integration with Profitwell
What other campaign metrics can you track and visualize with our Profitwell integration? Among others:
- Cash flow & Cash balance
- Accounts receivable and payable
- Consolidated net income
- Net sales
- Gross profit margin
- Top customers, vendors and products
There are many different metrics and metric combinations you can track using this integration. And in Databox, you can quickly visualize your most important financial metrics in various ways to help you create consolidated reports.
Read more about Databox’s Profitwell integration.
ProfitWell metrics included in this template
-
Churned Customers
Churned customers metric measures the number of customers who have canceled their subscription or stopped purchasing from your company during a given time period.
-
Churned Recurring Revenue
Churned Recurring Revenue measures the revenue lost due to customers cancelling their subscriptions or not renewing. It helps track the impact of churn on your business.
-
Customers Churn Rate
-
Downgraded Recurring Revenue
Downgraded Recurring Revenue measures the reduction in monthly or annual recurring revenue (MRR/ARR) due to customers downgrading their subscription plans or packages.
-
Net New MRR
Net New MRR is a metric that measures the total amount of revenue generated from new customers minus the revenue lost from cancellations and downgrades.
-
New Customers
New Customers metric measures the number of new users who signed up for your product or service within a given time period. It helps you track the growth of your customer base and evaluate the effectiveness of your marketing and acquisition efforts.
-
New Recurring Revenue
New Recurring Revenue measures the total revenue brought in by new subscriptions in a given period, excluding upgrades, downgrades, and churn.
-
Reactivated Customers
The Reactivated Customers metric measures the number of customers who have made a repeat purchase after being inactive for a period of time.
-
Reactivated Recurring Revenue
The Reactivated Recurring Revenue metric measures the revenue generated from previously churned customers who have come back to a subscription-based business. It helps track the effectiveness of a company's re-engagement efforts.
-
Revenue Churn Rate
Revenue Churn Rate measures the amount of revenue lost from canceled or downgraded subscriptions over a given period of time.
-
Revenue Retention Rate
Revenue Retention Rate measures how much recurring revenue you retain from existing customers over a period of time, after accounting for churn and upgrades/downgrades.
- Net new customers (PW)
-
Upgraded Recurring Revenue
The Upgraded Recurring Revenue metric measures the additional revenue generated by existing customers through upgrades or expansions of their subscription plans.