Uses one-click integrations:
-
 FreshBooks
If you don't use FreshBooks, you can pull data from any of our 130+ one-click, native integrations or from spreadsheets, databases and other APIs.
Try this dashboard for freeWhat you’ll learn from this FreshBooks Cash Overview Dashboard Template
By connecting your FreshBooks account, you’ll learn:
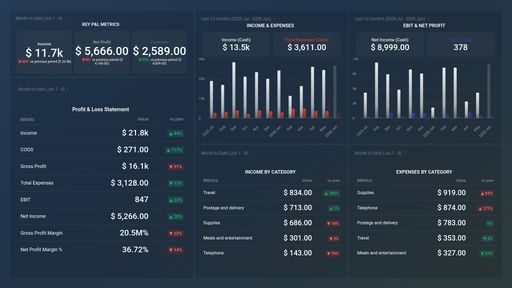
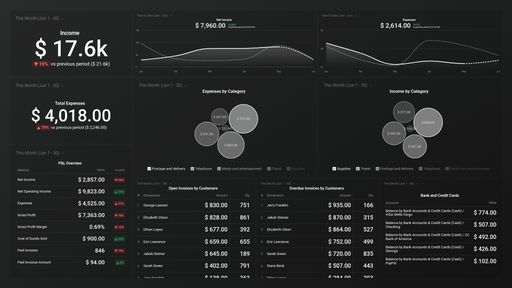
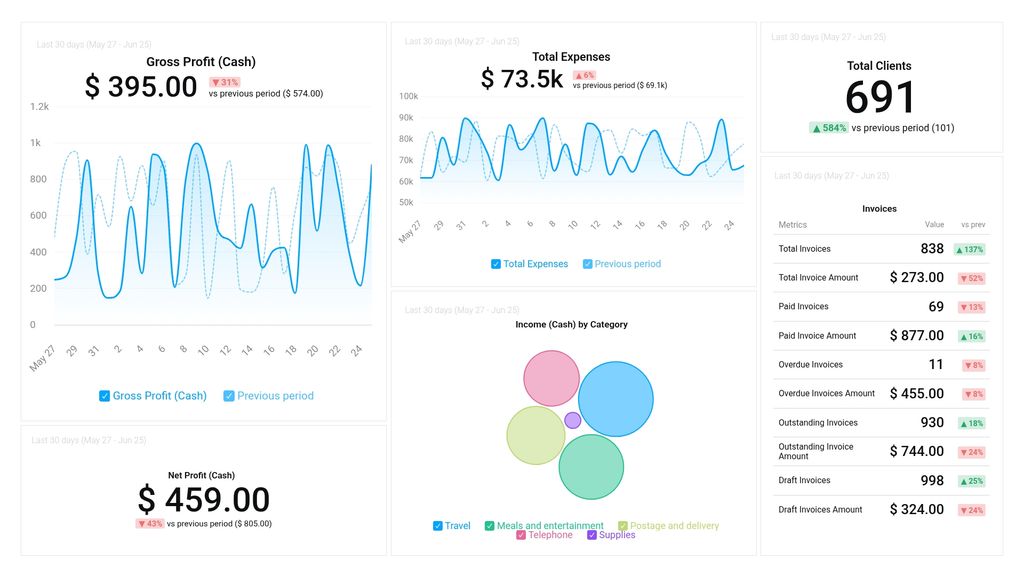
- How do you keep track of your invoices? Having a clear breakdown of your invoice-related metrics like Total Invoices, Total Invoice Amounts, Paid Invoices, and Overdue Invoices will give you a great insight into day to day cash flow of your business. And if you notice discrepancies in the numbers in real time, you can easily drill deeper and remove the cause.
- Which categories bring in the most cash income? Dig deeper to see which part of your business brings in the most cash income. This can help you reorganize better and see which areas you want to develop further.
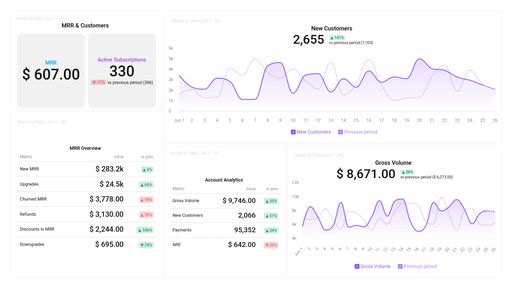
- How many clients do you have at any given time? Keep an eye on your client number in real time. If there is a steady rise, you can sit back and watch the numbers climb. However, if you notice either a sudden or gradual drop, it is time to find out why.
- Get a deeper understanding of your profitability. Query the essence of your cash profitability by examining your cash gross profit. It shows you the cash profit earned by your business after deducting the cost of goods sold from its revenue. It represents the amount of money left after accounting for the direct expenses associated with producing and selling a particular product or service.
Pull additional data using our robust integration with FreshBooks.
What other campaign metrics can you track and visualize with our integration with FreshBooks? Almost anything:
- Total Tax Amount
- Paid Invoices
- Total Clients
- Billable Hours
- Vendors and more
In Databox, there are dozens of FreshBooks metrics already built and ready for you to visualize in a variety of different ways. With the use of Metrics Builder and Data Calculations, the range of different metrics and metric combinations you can track from FreshBooks widens. Read more about Databox’s FreshBooks integration.
Explore more FreshBooks dashboards.
FreshBooks metrics included in this template
-
Gross Profit (Cash)
The Gross Profit (Cash) metric represents the total revenue generated by a business minus the cost of goods sold, providing a snapshot of the profitability before considering other expenses and taxes.
-
Income (Cash) by Category
Number of People who saw your Ads at least once during the specified Date Range split up by Campaigns.
-
Net Profit (Cash)
Net Profit (Cash) is a financial metric that represents the amount of money a business has left after deducting all cash expenses from its revenue. It indicates the profitability of a company and its ability to generate positive cash flow.