Uses one-click integrations:
-
 Drift
Drift
If you don't use Drift, you can pull data from any of our 130+ one-click, native integrations or from spreadsheets, databases and other APIs.
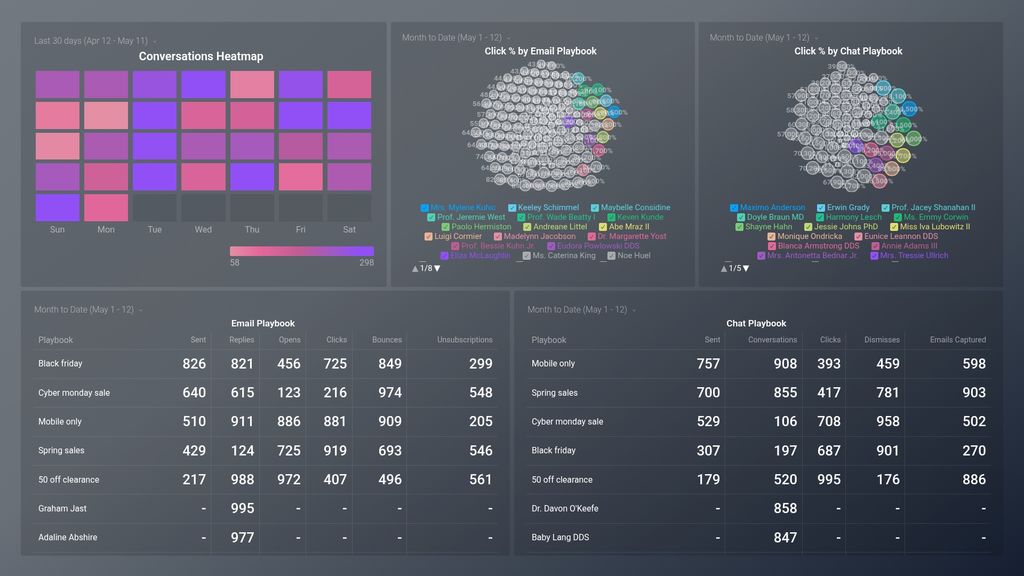
Try this dashboard for freeAnswer key questions regarding the reach of your Drift Campaigns
Determine what's successful and where there is room for improvement
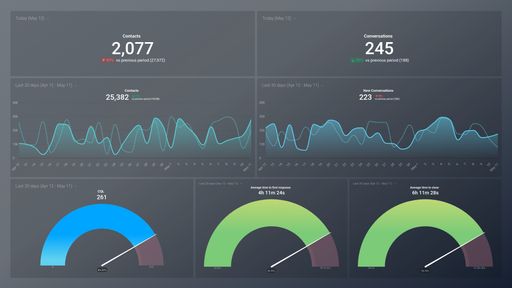
- How fast are we responding to website chats?
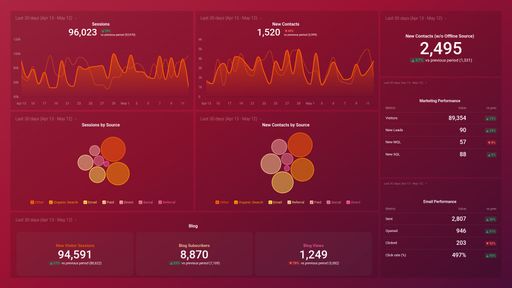
- How many new prospects did we generate from Drift this period?
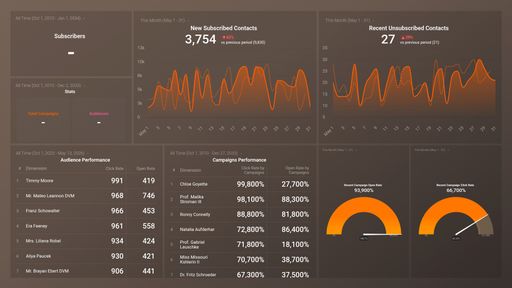
- Which Drift campaigns are performing best?
Key Metrics
- New Conversations
- Contacts
- Response Time
- Campaign Sent/Clicks/Opens