Easy-to-Use Google Ads Reporting Tool 

Build custom Google Ads dashboards and reports in minutes and easily keep track of all your campaign KPIs in one place. Then automate, share & take action, faster.

  • Everyone Starts Trial On Growth Plan
  • No Card Required
  • Free Plan Available
google ads dashboard

Trusted by 20,000+ growing businesses

  • profitwell
  • toast
  • Wistia
  • luminary
Track performance

Track your Google Ads performance, identify top-performing ads, uncover trends, and gain insights tomaximize ROI.

Monitor engagement

Track engagement metrics like click-through rates (CTR), conversions, and cost-per-click (CPC) to evaluate ad effectiveness.

Real time updates

Pull key metrics automatically to keep track of the most important data across every PPC advertising account.

Automate & share

Automate Google Ads reports and deliver them directly to email or Slack, or share a public link.

Easily track your Google Ads performance

Monitoring PPC performance data can be complex, and sharing it can often be a hassle. Databox makes it easy to create customizable dashboards and reports for your Google Ad metrics with no coding required and updates them automatically. No more manual reporting needed.

CONNECT
google ads integration

Pull data directly from Google Ads

Connect one or more Google Ads accounts to start visualizing metrics, no coding required. Just log in and plug data into your reports and dashboards.

VISUALIZE
visualize linkedin metrics

Pull data directly from Google Ads Manager

Manage your dashboards with ease, using our drag and drop designer. Drill down into specific campaigns, view ad creatives, benchmark your data, compare time periods, and more.

COMPARE
build linkedin dashboards

Blend insights with data from other advertising platforms

Compare performance across multiple web, e-com and PPC platforms in a single, intuitive report and quickly turn it into automated report.

Databox Google Ads analytics tool helps you uncover more insights

Databox goes way beyond data visualization and reporting by helping you uncover new insights, spot trends, and make better decisions. We took the best tools normally found in complicated enterprise analytics platforms and BI tools, and made them accessible and easy to us. Perfect for teams who need data-informed answers, and analysts who don’t want to be a bottleneck!
Metrics & KPIs

Monitor all of your PPC metrics and KPIs, all in one place.

Visualize

Build and share beautiful Google Ads dashboards to visualize metrics and trends.

Share

Put all your reports on autopilot, add data stories and schedule via email or Slack.

Track

View your PPC goals progress and get alerted when goals are off track.

Forecast

Predict future performance of your Google Ads to plan better now.

Benchmark

See how your paid ads data compares to similar companies, and where there’s room to improve.

Every Google Ads reporting feature you need

Databox offers a comprehensive set of reporting features to help you tailor your Google Ads analytics. Customize metrics to match your goals and apply your brand’s style to reports. Set alerts to stay on top of performance, add annotations for context, and track progress with goal-setting tools—all designed to give you full control over your reporting and insights.

Build fully customizable dashboards – from looks to metrics

With an intuitive drag-and-drop designer, you can easily create dashboards that fit your needs. Choose from over 4,000 pre-built metrics or create custom ones, combining data from multiple sources to build calculated metrics. Select from a variety of visualization types, filter data to your preference, and leverage AI-powered summaries. Personalize your dashboards further by adding custom colors, logos, backgrounds, or even white-labeling them to match your brand.

Save time with team templates and loops

Choose between fully customizable dashboards or use 1-click templates to quickly get started. Once you’ve built your dashboards, save them as team templates for easy reuse or duplication with just a few clicks. Group multiple dashboards together with looped databoards to present a broader, more comprehensive view of your data.

Mark important events or notes

Add short text notes to specific dates to provide important context. Explain spikes, dips, or key events that impacted performance, helping your team understand why changes occurred.

Get notified when your metrics change

Stay on top of your Google Ads reporting metrics with alterts whenever important KPIs increase or decrease by a set threshold. Schedule scorecards for daily, weekly, or monthly updates on up to 15 metrics, or set up snapshots to share key dashboards with your team or clients via email or Slack. Use the performance screen to get an overview of your most important metrics, or leverage AI-generated summaries for quick insights into your performance.

Set a goal for any metric or KPI

Easily track your marketing goals by defining them for any Google Ads reporting metric, including custom ones. Monitor progress with a variety of visualizations like gauge charts, progress bars, tables, and line or bar charts. Select up to 15 metrics and receive automated reports to see how your current performance compares to the goals you’ve set.

Set Facebook reports on autopilot or share instantly

Set your Google Ads reports on autopilot or share them instantly with ease. Customize reports by adding covers, formatted text, images, dashboards, data stories, and your brand’s logo and colors. With just one click, add dashboards or metrics to presentation slides and combine visuals with automated performance summaries. Set a schedule to automatically export reports daily, weekly, monthly, or quarterly via email or Slack. Alternatively, share a public URL for live presentations, skipping the PDF. Save reports as templates for faster launches and consistent formatting every time.

customize linkedin dashboard

Build fully customizable dashboards – from looks to metrics

With an intuitive drag-and-drop designer, you can easily create dashboards that fit your needs. Choose from over 4,000 pre-built metrics or create custom ones, combining data from multiple sources to build calculated metrics. Select from a variety of visualization types, filter data to your preference, and leverage AI-powered summaries. Personalize your dashboards further by adding custom colors, logos, backgrounds, or even white-labeling them to match your brand.

linkedin dashboard template

Save time with team templates and loops

Choose between fully customizable dashboards or use 1-click templates to quickly get started. Once you’ve built your dashboards, save them as team templates for easy reuse or duplication with just a few clicks. Group multiple dashboards together with looped databoards to present a broader, more comprehensive view of your data.

annotations 2

Mark important events or notes

Add short text notes to specific dates to provide important context. Explain spikes, dips, or key events that impacted performance, helping your team understand why changes occurred.

alerts

Get notified when your metrics change

Stay on top of your Google Ads reporting metrics with alterts whenever important KPIs increase or decrease by a set threshold. Schedule scorecards for daily, weekly, or monthly updates on up to 15 metrics, or set up snapshots to share key dashboards with your team or clients via email or Slack. Use the performance screen to get an overview of your most important metrics, or leverage AI-generated summaries for quick insights into your performance.

track linkedin metrics

Set a goal for any metric or KPI

Easily track your marketing goals by defining them for any Google Ads reporting metric, including custom ones. Monitor progress with a variety of visualizations like gauge charts, progress bars, tables, and line or bar charts. Select up to 15 metrics and receive automated reports to see how your current performance compares to the goals you’ve set.

likedin automated report

Set Facebook reports on autopilot or share instantly

Set your Google Ads reports on autopilot or share them instantly with ease. Customize reports by adding covers, formatted text, images, dashboards, data stories, and your brand’s logo and colors. With just one click, add dashboards or metrics to presentation slides and combine visuals with automated performance summaries. Set a schedule to automatically export reports daily, weekly, monthly, or quarterly via email or Slack. Alternatively, share a public URL for live presentations, skipping the PDF. Save reports as templates for faster launches and consistent formatting every time.

Save time with ready-to-go Google Ads templates

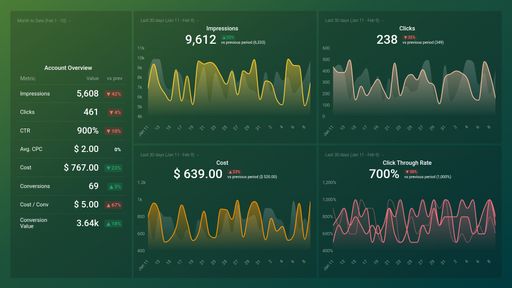
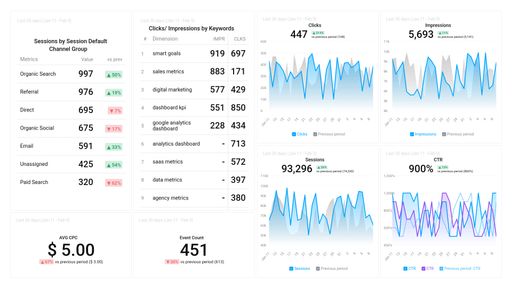
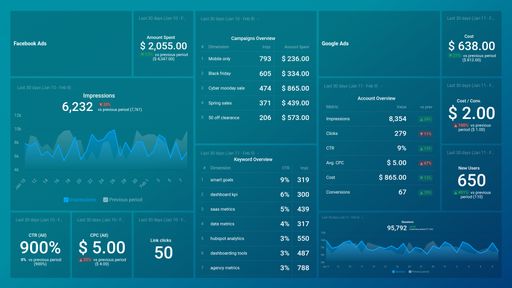
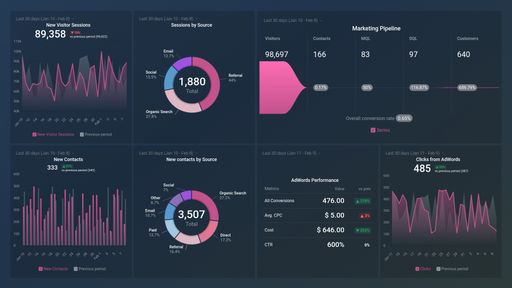
Our pre-built Google Ads dashboard and report templates provide a comprehensive view of your campaign performance and key metrics. With just a few clicks, each template pulls your most important performance metrics directly from your Google Ads Manager account, displaying essential insights like CTR, CPC, ad spend, and engagement metrics.
Sign Up for a Free 14-Day Trial

Explore top Google Ads metrics

Discover the key metrics that drive success on Google Ads, with 60+ pre-built options ready for you to use in your dashboards. Explore all the metrics you can easily add to your Google Ads dashboards and reports here.
Clicks
Impressions
Cost
Conversions
Avg. CPC
CTR
Cost/Conversion
Impressions by campaign
CTR by campaign
Avg CPC by campaign
Conversion rate
Conversion value
Impressions by keyword
Conversion value by keyword
Cost/conversion by keyword ID
Impressions (absolute top%)
Search impressions share
View-through conversion by campaign
Interaction rate by ad group

No switching between platforms. Connect every integration you need.

You can combine your Google Ads data with services like Google Analytics 4, Hubspot, Shopify, and more to build dashboards that paint a picture of your advertising funnel. Databox makes it easy to pull in data from 100+ platforms you use the most. These integrations are designed to save you time, reduce manual work, and provide a 360-degree view of you marketing performance.
calendly integration google analtics 4 integration quickbooks integration jira integration pipedrive integration github integration profitwell integration salesforce integration intercom integration twitter x integration helpscout integration woo commerce integration xero integration ahrefs integration tiktok integration

And if you need important metrics from a different data source, no worries. You can connect powerful software integrations,  APIs, Databases and custom Spreadsheets. 

Your Software

Sync data from 100+ software tools

APIs

Sync custom data from a Cloud-Based app with API access

A Database

Use MySQL queries to pull data from your database

Spreadsheets

Track custom metrics from Google Sheets or Excel

Build your Google Ads reporting dashboard in 5 minutes or less

Test drive every feature Databox has to offer with our 14-day Growth plan trial. After the trial, you can choose the plan that best suits your needs, from our Free-Forever option to premium upgrades.

Sign Up for a Free 14-Day Trial

No Credit Card. Cancel Anytime.

Trusted by 20,000+ growing businesses

G2 4.8 stars
Enterprise High Performer Winter 2024 award, Europe Winter 2024 Leader award, Small Business Leader winter 2024 award
Capterra 4.5 stars

Frequently asked questions

What is a Google Ads dashboard?

Google Ads dashboard provides digital marketers with the ability to track and visualize their campaign performance in real-time. It also allows marketers and agencies to stay on top of their and their client’s key metrics for Google Ads campaigns. A Google Ads dashboard is a great way to keep your team and clients informed on the success of your paid search campaigns.

What should be included in a Google Ads dashboard?

Choosing the right metrics and KPIs is essential for Google Ads reporting. Your dashboard needs to provide key insights on the quality and effectiveness of your campaigns. This is why a Google Ads dashboard should include the following metrics – Cost per Click (CPC), Click through Rate (CTR) and Return on Investment (ROI). You can add even more metrics to your dashboard if you want to share deeper insights.

How to create a Google Ads dashboard

With our dashboard design wizard, building a dashboard in Databox is as simple as connecting a data source, choosing the metrics you need from our Metrics Library, and waiting for your data to populate — which only takes a few seconds. No coding and design skills are required.

Can I create dashboards combining data from different sources?

Yes! In fact, we recommend doing this to get a comprehensive view of performance. Inside the dashboard builder, you can swap through different data sources you’ve connected and pull whatever metrics you need right into your dashboard. 

How can I share my dashboard?

In Databox, you have multiple sharing options.

  1. Shareable Link: Dashboards can easily be shared and accessed through a link. It will display your dashboard(s) with the same date range options and visualizations you have set in your account. Shareable Links are best for sharing live data with your teams, executives, or clients. 
  2. Scheduled Snapshots: You can export your dashboards into PDFs or JPGs at regular time intervals. Scheduled Snapshots are best for sharing static views of your data (regularly) with the relevant recipients. The best part is that recipients don’t need to be Databox users.
  3. Embeds: You can embed your dashboards on web pages or tools like ClickUp/Notion. Embeds allow you to incorporate your insights directly into your existing workflow. 
  4. Stream To TV: With Databox, you can easily stream your dashboard on a Smart TV. This option is valuable for sharing insights in office settings, team meetings, or presentations. 

How can I share a report?

Our business reporting tool allows you to share multiple ways:

  1. Download as PDF: You can choose to share your Reports by downloading them as PDFs. This format allows you to easily share via email or store your reports as needed.
  2. Send to Email: You can send an email (either immediately or scheduled) to any email address from within the Reports Editor. All you have to do is enter the recipient’s emails, the subject of the message, and any additional text you would like to include.
  3. Send to Slack: Reports can also be sent to Slack channels, either immediately or at a scheduled date and time.
  4. Automate: You can set a schedule to automatically export the Report daily, weekly, monthly, or quarterly.

Can I combine multiple dashboards?

Yes! Dashboard Loops allows you to group multiple dashboards together to tell a more comprehensive story with your data. They’ll be joined together on one Shareable link that you can then share with your team and/or clients. You can add up to 20 dashboards to a loop.

Can I view my dashboards on my phone?

Yes, using our Databox mobile app for iOS and Android. And, you can receive your daily scorecards, weekly summaries, and performance alerts directly to your mobile phone.

Can I change the logo and customize my dashboard?

Yes, you can change the colors of your dashboards and charts. And customize the logo on your dashboards to reflect your brand. Even better, you can provide create a fully branded experience with the white-label add-on. Personalize the login screen, URL, mobile app, and much more.

What happens after my free trial?

During the 14-day trial, you can purchase a paid plan and your first payment will be at the end of the trial period. If you do not purchase, the trial will simply expire and you’ll be prompted to continue on the Free Plan. We do not require a credit card to start a trial.

All Databox software and customer data are securely housed within Amazon AWS infrastructure, ensuring compliance with AWS security certifications and GDPR standards.

AWS security certification and GDPR compliant badges