TL;DR
- To use Claude for data analysis and reporting, start by uploading a spreadsheet, connecting your business apps through MCP, or connecting an analytics platform like Databox. Then describe what you want to analyze, ask follow-up questions to explore the findings, and have Claude turn the results into charts or reports.
- Claude can clean data, analyze performance, create charts and dashboards, and turn findings into reports and downloadable files, all through natural language.
- The reliability of Claude’s analysis depends on what it can access. Usage limits, incomplete data from connectors, inconsistent metric definitions, missing business context, limited history, and changing analytical methods can all affect its results.
- These limitations matter most for recurring reporting and for decisions that draw on data from several tools.
- Connecting Claude to Databox through MCP gives it complete performance data, governed metrics, business context, and built-in analytical methods, so its analysis is easier to verify and act on.
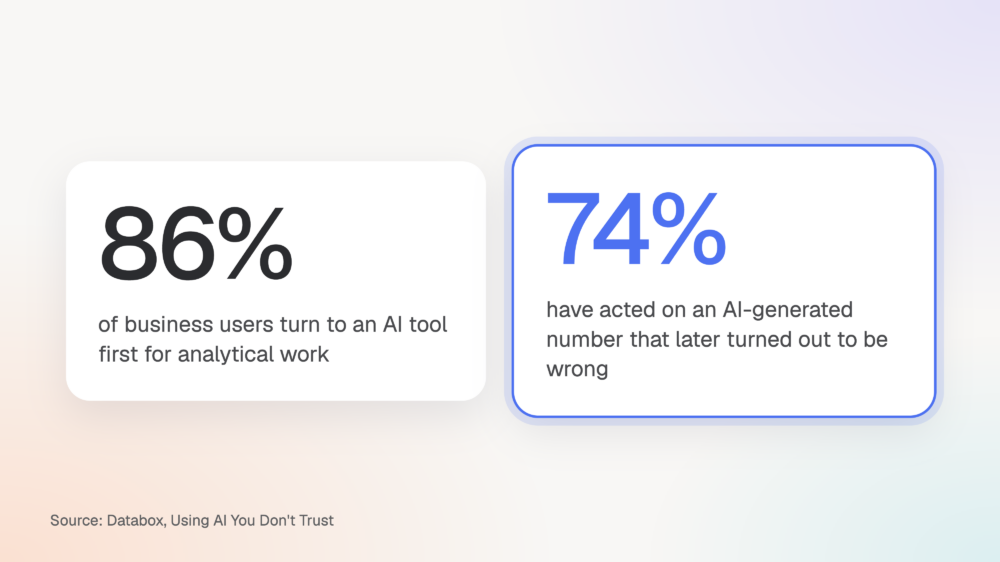
Claude has become the place where a lot of everyday work gets done, and analysis and reporting are no exception. In Databox’s recent survey, Using AI You Don’t Trust, 86% of business users said they reach for an AI tool like Claude or ChatGPT before any other tool for analytical work.
Honestly, the pull toward these tools is easy to understand. Feed Claude a spreadsheet, and it can synthesize your data, spot trends, and turn raw numbers into written explanations and reports in minutes.
But what most people don’t realize is how often that analysis goes wrong. The same survey found that 74% of business users have shipped a decision, report, or shared output based on an AI-generated number that later turned out to be wrong. Incomplete datasets, inconsistent metric definitions, missing business context, and unclear analytical methods can all affect the accuracy of its findings.
In this blog, we’ll walk through how to use Claude for data analysis and reporting, explore the limitations that can affect its results, and explain how to improve the reliability of its analysis with the right data foundation.
Claude’s key capabilities for data analysis and reporting
Claude can help with a range of analytical tasks, from cleaning and exploring datasets to creating visualizations and reports. Here are some of the main ways businesses can use Claude to work with their data.
Clean and prepare data
Claude can work with CSV files and Excel spreadsheets to help you clean, organize, and prepare data for analysis. It can identify missing values, flag inconsistencies, standardize formats, and filter or group records to make large datasets easier to work with.
For example, you could upload a spreadsheet containing marketing campaign data from multiple platforms and ask Claude to identify missing information, standardize campaign names, and organize the data into a consistent format for further analysis.
Analyze and interpret data
Claude can analyze information from spreadsheets, screenshots, and connected tools to help you understand what the numbers show. You can ask questions in natural language, compare results across reporting periods, identify patterns and trends, and investigate changes in performance.
For example, you could ask Claude to review six months of lead generation data, identify when performance increased or declined, and investigate which campaigns or channels contributed to those changes.
Create charts and dashboards
Claude can turn datasets into charts and visualizations that make information easier to explore and communicate. With Claude Dashboards, currently in beta on paid plans, you can also connect a data platform or CRM and create interactive dashboards by describing what you want to see in natural language.
For example, you could ask Claude to visualize monthly revenue, lead generation, and advertising spend over time, or create a dashboard that lets you explore performance across different marketing channels.
Generate reports and performance summaries
Claude can organize data and analytical findings into structured reports that include KPI summaries, tables, charts, and written explanations. It can also generate downloadable Excel spreadsheets, Word documents, PDFs, and PowerPoint presentations, making it easier to turn your analysis into materials you can review and share.
For example, you could ask Claude to prepare a monthly marketing performance report that summarizes campaign results, highlights important changes, and identifies areas that may require further investigation.
How to use Claude for data analysis and reporting
Getting started with Claude for data analysis is relatively straightforward, even without a technical background. Let’s walk through an example of analyzing marketing campaign performance and preparing a monthly report.
Step 1: Upload your data or connect a data source
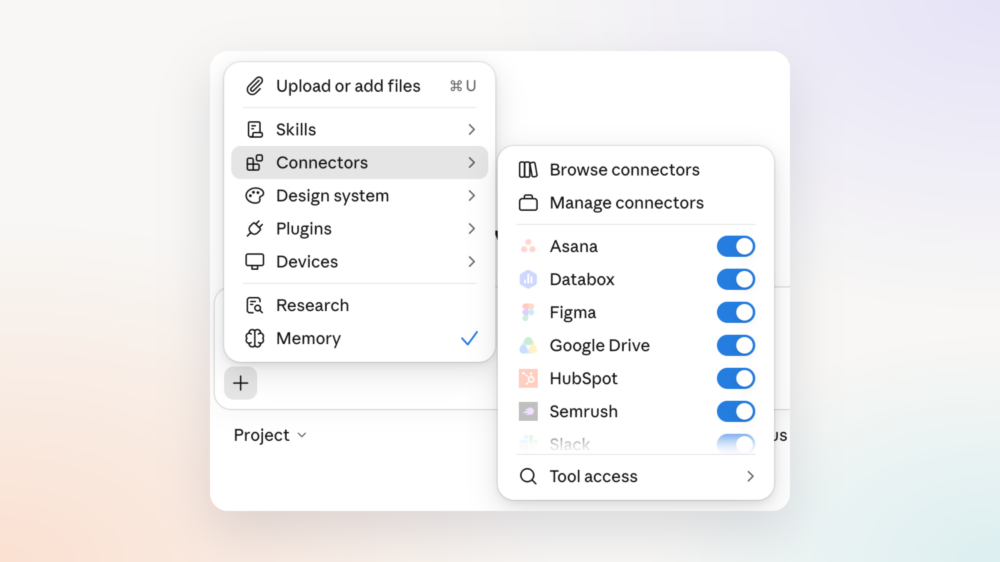
Start by giving Claude access to the data you want to analyze. You can upload CSV or Excel files directly into a conversation or connect supported external data sources through integrations, including MCP connectors. To compare the different ways of doing this, see how to connect your business data to Claude.
To upload a file, open Claude, click the + icon in the message box, select Add files or photos, and choose your file.
For this example, we’ll use a spreadsheet containing marketing campaign performance data from August and September, including advertising spend, clicks, and leads.
Step 2: Tell Claude what you want to analyze
Once your data is available, describe what you’d like Claude to investigate. You can ask questions in natural language and specify whether you want a summary, comparison, or more detailed analysis.
Example prompt:
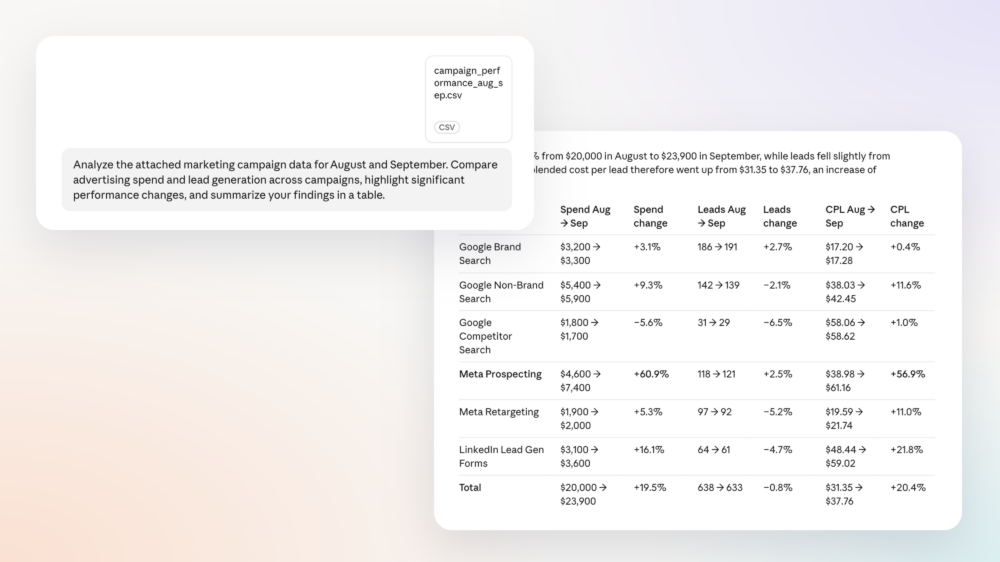
“Analyze the attached marketing campaign data for August and September. Compare advertising spend and lead generation across campaigns, highlight significant performance changes, and summarize your findings in a table.”
Claude will review the available data and generate an initial analysis based on your request.
Step 3: Explore the results with follow-up questions
You can continue the conversation to investigate specific findings, explore patterns, or understand what may have contributed to a performance change.
Example prompt:
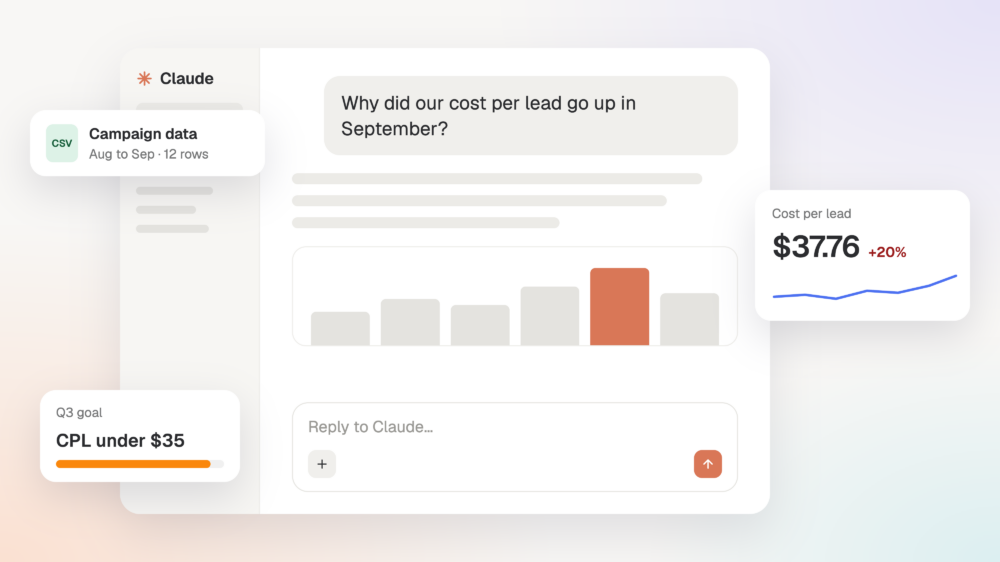
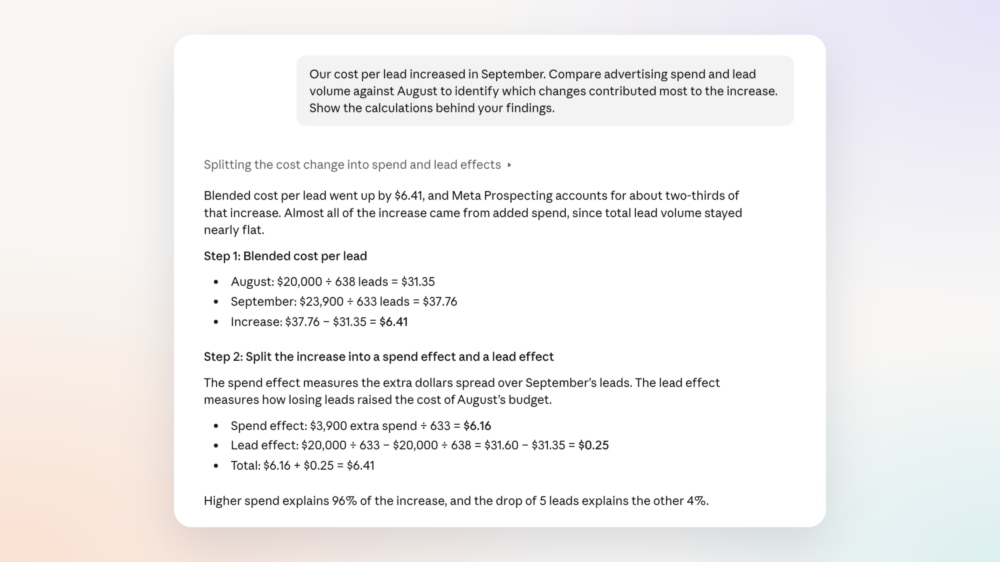
“Our cost per lead increased in September. Compare advertising spend and lead volume against August to identify which changes contributed most to the increase. Show the calculations behind your findings.”
You can also ask Claude to create additional breakdowns, explain its calculations, or investigate other questions that come up during the analysis.
Step 4: Generate a report or visualization
Once you’ve finished exploring the data, ask Claude to organize the findings into a report or visualization. Claude can create charts, tables, and written summaries, as well as downloadable files in formats such as Excel, Word, PDF, and PowerPoint.
Example prompt:
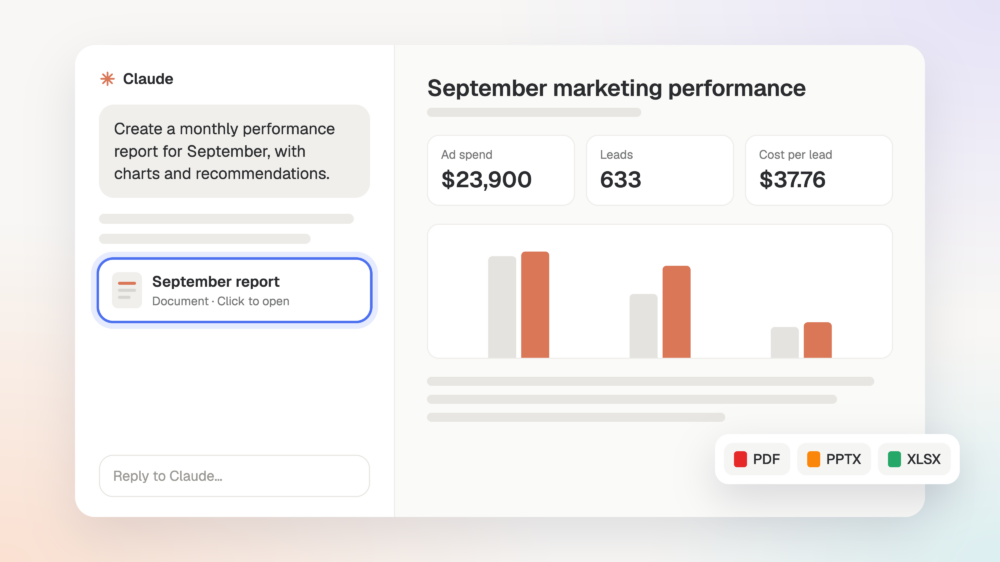
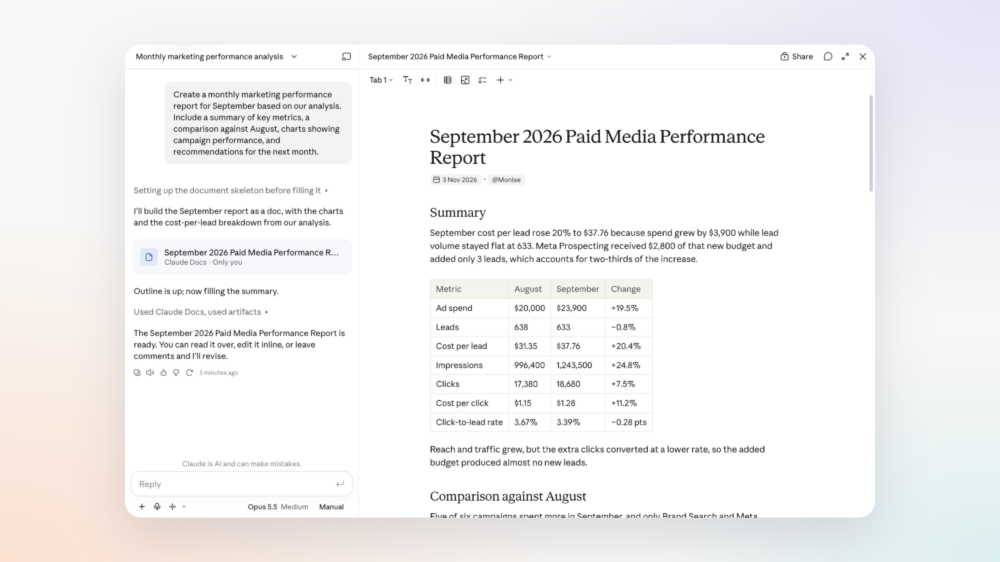
“Create a monthly marketing performance report for September based on our analysis. Include a summary of key metrics, a comparison against August, charts showing campaign performance, and recommendations for the next month.”
Claude will generate a report that you can review, refine, and share with your team. If you’re preparing a report for leadership, here’s how to turn your metrics into a monthly executive brief with AI.
While this process makes it easier to analyze data and prepare reports, there are some important limitations to consider before relying on the results for business decisions.
What are Claude’s limitations for data analysis and reporting?
While Claude makes it easier to analyze data and generate reports, there are some limitations worth considering, especially when you’re using it to monitor business performance, analyze data across multiple systems, or make decisions based on its recommendations.
1. File upload, context, and usage limits
Claude has limits on how much data it can process and how frequently you can use it, depending on your subscription. According to Anthropic’s documentation, individual file uploads can be up to 500 MB, with a maximum of 20 files per chat. The amount of information Claude can process in a conversation is also limited by its context window.
Large datasets, complex analyses, and repeated requests can consume more tokens and count toward your usage limits. For businesses working with substantial amounts of performance data, this can mean splitting datasets, narrowing the scope of analysis, or running into usage restrictions when preparing frequent reports.
2. MCP connectors don’t always provide the complete picture
Claude can connect directly to business applications through MCP connectors, making it easier to access data without manually uploading files. However, each connector determines what information Claude can retrieve, and the underlying APIs may have additional restrictions.
For example, a CRM connector might provide access to current deals but not all the historical changes needed to understand how your pipeline has evolved. Similarly, some connectors may limit which metrics, dimensions, or records can be retrieved.
As a result, you might ask Claude to analyze performance across your business without realizing it’s working with only part of the available information. This can lead to incomplete reports or conclusions that overlook important factors. For a closer look at why this happens, see how MCP and API-based integrations differ.
3. Inconsistent metric definitions can produce conflicting numbers
When you’re analyzing data across multiple business systems, the same metric doesn’t always mean the same thing.
Take revenue, for example. Your CRM might report revenue based on closed deals, while your payment platform reports completed transactions and your advertising platform attributes revenue according to its own attribution rules.
Claude can work with these numbers, but it doesn’t automatically know which definitions your business follows or how they should be reconciled.
Without consistent metric definitions, you could end up with reports where revenue, conversions, or other KPIs don’t match the numbers your team uses elsewhere. This creates additional work validating calculations and reconciling discrepancies before you can confidently share the results. We explain this in more detail in why AI tools give different numbers for the same question.
4. Missing business context can lead to irrelevant recommendations
Understanding what changed in your performance data is only part of the analysis. To make useful recommendations, Claude also needs to understand your business goals, priorities, and the circumstances behind those changes.
For example, a 20% decline in lead generation might initially look concerning. However, if your team deliberately reduced advertising spend to focus on profitability or higher-quality leads, that decline may be entirely expected.
Without that context, Claude might recommend increasing advertising spend when doing so would conflict with your current strategy.
This means you could receive recommendations that seem reasonable based on the numbers but don’t reflect what your business is actually trying to achieve.
5. Limited historical data can make trends harder to interpret
Historical performance data provides the baseline needed to understand whether a change is significant, seasonal, or part of a longer-term trend.
Claude can analyze historical information, but only when that data is available through uploaded files or connected sources.
For example, a decline in website traffic compared with the previous month might appear unusual, while looking at several years of data could reveal that similar declines happen every year.
Without sufficient historical information, Claude may struggle to distinguish meaningful changes from normal fluctuations. This can affect the quality of trend analysis, anomaly detection, and forecasts, making it harder to understand whether performance actually requires attention.
6. Analytical methods may vary between reports
Claude can perform advanced analysis, including trend analysis, anomaly detection, correlations, and forecasting. However, these tasks require appropriate analytical methods, and Claude may choose different approaches depending on your instructions and the information available.
For example, Claude might identify an anomaly by comparing performance against a historical average in one report, then apply a different statistical threshold in the next. Forecasts can also vary based on the model, historical periods, and assumptions used.
Even when the individual calculations are correct, these differences can produce inconsistent conclusions.
For businesses reviewing performance regularly, this makes it harder to compare results over time, reproduce findings, and confidently determine whether a change in performance is meaningful.
7. Recurring reporting still requires preparation and maintenance
Generating a report from a spreadsheet is relatively straightforward, but producing consistent reports every week or month requires more than repeating the same prompt.
Your data needs to remain current, metric definitions must be applied consistently, and reporting periods and analytical methods need to stay aligned.
Claude offers connectors, projects, reusable instructions, and scheduling capabilities that can help automate parts of this process. However, maintaining the underlying data and reporting workflows remains important.
Without a reliable setup, you may spend time exporting and preparing data, repeating instructions, and checking calculations each reporting cycle, reducing the time savings that initially made AI reporting attractive.
What does this mean for businesses using Claude?
These limitations don’t mean Claude isn’t capable of performing business analysis. For one-off analysis, such as exploring a spreadsheet or answering questions about data from a connected application, Claude may provide everything you need, especially when you can verify the results against the original source.
However, when you’re analyzing performance across multiple systems, producing recurring reports, or using AI findings to make business decisions, the reliability of those results becomes more important. For these use cases, reliable analysis depends on access to complete and current data, consistent metric definitions, relevant business context, and established analytical methods.
With the right foundation in place, Claude can work with a more complete understanding of your business and produce analysis that’s easier to verify, compare, and act on.
How to improve Claude’s data analysis and reporting with Databox
You can improve the reliability of Claude’s analysis and reporting by connecting it to Databox through MCP. For the full comparison, read what Databox adds to Claude and ChatGPT.
Databox brings connected performance data, governed metrics, business context, and built-in analytical capabilities together in one agentic analytics platform. By connecting Databox to Claude, you can give it access to the data and information it needs to better understand your business performance and produce more reliable analysis.
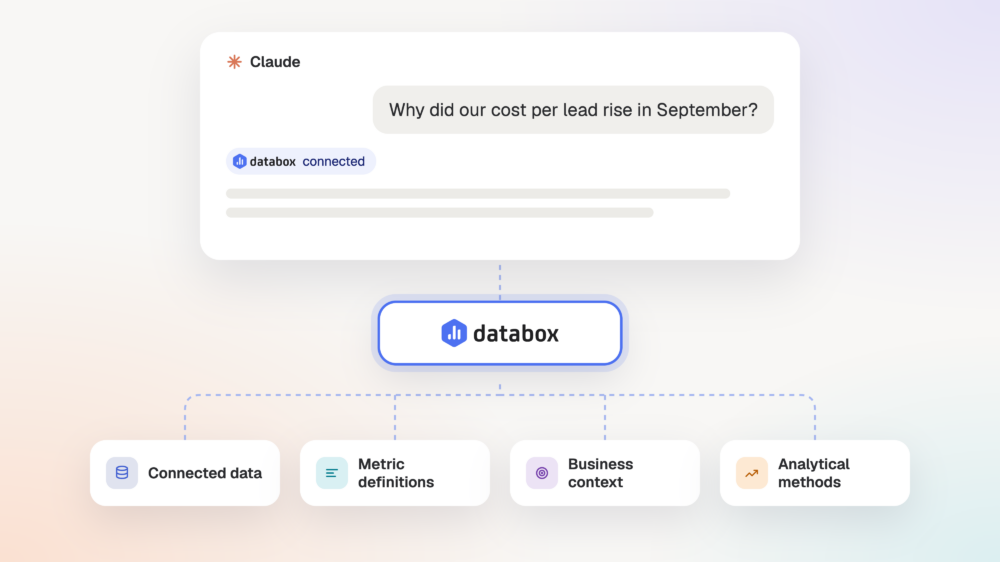
Here’s how these capabilities support more reliable business analysis and reporting.
1. Connect your business data in one place
Most businesses use several tools to manage different parts of their operations. Marketing data might live in Google Ads and Meta Ads, sales information in HubSpot, and revenue data in Stripe. Analyzing performance across these systems often means exporting information, combining spreadsheets, and checking whether the numbers are up to date.
Databox brings this data together through 130+ native integrations, alongside connections to databases, warehouses, spreadsheets, and custom sources. It also handles the underlying work of collecting, storing, and maintaining performance data, including historical information.
What this means for you: You can spend less time gathering and preparing data, while giving Claude access to a more complete view of your business performance. Because Databox maintains the connections and historical data, you can investigate performance across different systems without having to rebuild your dataset every time.
2. Keep your metrics and calculations consistent
As we discussed earlier, different business systems often use different definitions for the same metric. Without a consistent way to calculate revenue, conversions, or customer acquisition cost, the numbers in your reports may not match.
Databox addresses this through its governed metrics layer, which includes thousands of prebuilt metrics, along with custom metrics, datasets, definitions, and calculations.
You can define how your business measures performance and apply those definitions consistently across dashboards, reports, and analysis.
What this means for you: When Claude accesses your metrics through Databox, it can work with the same definitions and calculations your team already uses. This makes your analysis easier to verify and reduces the risk of conflicting numbers across different reports.
3. Give Claude the business context behind your performance
Numbers alone don’t always explain whether your business is performing well. To interpret results accurately, AI also needs to understand what you’re trying to achieve and what’s happening across your business.
Databox brings together performance data with business context, including your goals, priorities, constraints, documents, and other relevant information.
For example, if your advertising costs increased because your team deliberately expanded into a new market, that information helps explain the change and whether it aligns with your strategy.
What this means for you: With relevant business context available through Databox, Claude can go beyond describing performance changes and provide insights and recommendations that better reflect your goals and priorities. You also reduce the need to repeatedly explain your business circumstances in every conversation.
4. Apply consistent analytical methods to your data
Understanding performance often involves more than comparing individual numbers. You may need to identify unusual changes, investigate relationships between metrics, forecast future results, or explore what would need to change to reach a target.
Databox provides built-in analytical capabilities for period comparisons, trend analysis, anomaly detection, correlation analysis, forecasting, and scenario modeling. These methods operate on your governed metrics, providing a more consistent approach to analyzing performance.
What this means for you: Rather than relying entirely on Claude to select and recreate calculations for each analysis, you can draw on established analytical methods available through Databox. This makes it easier to investigate performance, compare findings over time, and understand which changes deserve attention.
What changes when you use Claude with Databox?
Let’s return to our earlier example of preparing a monthly marketing performance report.
Using Claude with uploaded spreadsheets: You would typically export campaign data from your marketing platforms, combine the information, and explain how your business calculates its KPIs. You would also need to provide relevant goals and reporting instructions, then review how Claude performed its analysis.
Using Claude with direct MCP connectors: You skip the exports, and Claude pulls data from each tool when you ask. You still need to explain how your business calculates its KPIs, confirm that Claude retrieved every record it needed, and reconcile numbers that each tool defines differently.
Using Claude connected to Databox: Claude can retrieve the performance data and metrics already maintained in Databox, along with relevant business context and supported analytical capabilities. You can ask questions about campaign performance, investigate changes, and prepare your report using that established foundation.
Final thoughts
Claude makes it easier for businesses to explore data, investigate performance, and create reports without relying on technical expertise for every analytical task.
However, as your reporting needs become more complex, the quality of the underlying data and how it’s analyzed become increasingly important. Having access to complete performance data, consistent metric definitions, relevant business context, and established analytical methods can make a significant difference in how useful and reliable the results are.
Databox brings these capabilities together in one platform, giving AI the foundation it needs to work with your business performance data.
Whether you prefer working directly with Databox’s AI Analyst or connecting Databox to Claude through MCP, you can spend less time preparing data and more time understanding performance and acting on what matters.
FAQ
Frequently asked questions about Claude data analysis
Is Claude accurate for data analysis?
Claude’s accuracy depends mostly on the data it works with. Incomplete records, metric definitions that differ between tools, and short history all produce wrong answers that look correct. In Databox’s survey Using AI You Don’t Trust, 74% of business users said they had shipped a decision, report, or shared output based on an AI-generated number that later turned out to be wrong, and 59% got different answers when they re-ran the same question. Checking key numbers against source data and connecting Claude to governed metrics both reduce that risk.
Can Claude analyze Excel and CSV files?
Yes. Claude can analyze CSV files and Excel spreadsheets to help organize data, calculate metrics, identify patterns, and generate reports. Excel analysis requires the relevant code execution capabilities to be available.
What is Claude’s file upload limit?
According to Anthropic’s documentation, Claude supports individual chat file uploads of up to 500 MB, with a maximum of 20 files per chat. Project files have a separate 30 MB per-file limit, and context and usage restrictions may also apply.
Can Claude analyze data from multiple business platforms?
Yes. Claude can analyze information from multiple platforms through uploaded files or supported connectors, including MCP integrations. The completeness of the analysis depends on the information each source makes available.
Can Claude create reports and dashboards?
Yes. Claude can generate charts, visualizations, spreadsheets, and formatted reports. It also supports interactive dashboards using compatible connected data sources.
Can Claude automate recurring data analysis and reporting?
Claude supports scheduled tasks and automation capabilities in supported environments. However, recurring reporting still requires maintaining data connections, metric definitions, and analytical instructions to keep results consistent.