Uses one-click integrations:
-
 Google Analytics 4
-
 HubSpot Marketing
-
 Facebook Pages
-
 Instagram Business
-
 LinkedIn Company Pages
-
 X (Twitter)
-
 SEMrush
If you don't use Google Analytics 4, HubSpot Marketing, Facebook Pages, Instagram Business, LinkedIn Company Pages, X (Twitter) or SEMrush, you can pull data from any of our 130+ one-click, native integrations or from spreadsheets, databases and other APIs.
Try this dashboard for free
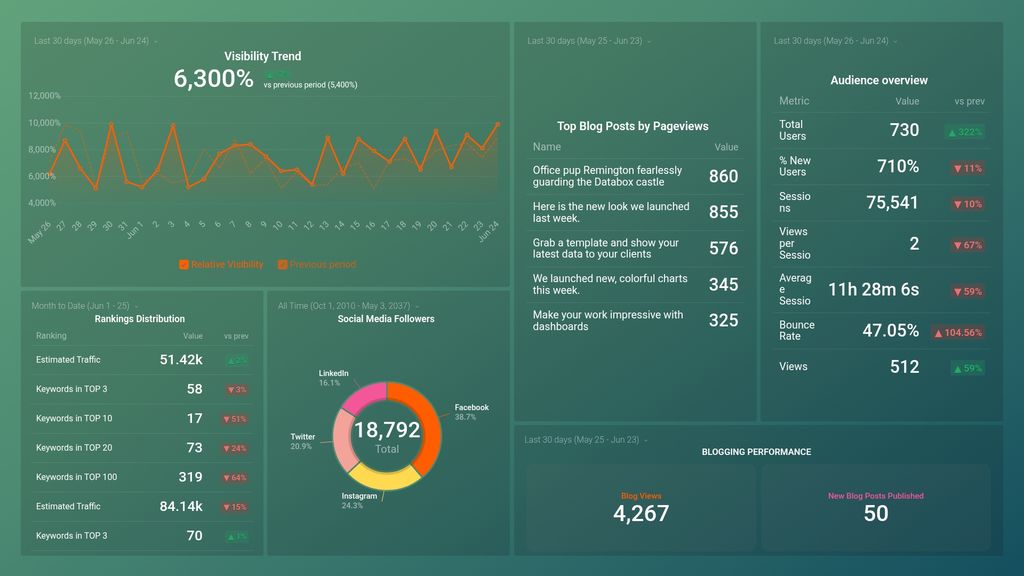
Google Analytics 4 metrics included in this template
-
Average Session Duration
Average Session Duration is the average length of time visitors spend on your website during a single session, measured in seconds. This metric provides insight into visitor engagement and can help identify areas for improvement in site content or user experience.
-
Bounce Rate
Bounce Rate is a metric in Google Analytics that represents the percentage of visitors who leave a website without interacting with other pages or elements on the site.
-
Views
Views is a metric in Google Analytics 4 that tracks the number of times a particular page or screen is viewed by a user on your website or app.
-
Views per Session
Views per Session is a Google Analytics 4 metric that calculates the average number of pages viewed during a single session on your website or app.
- % New Users
-
Sessions
Sessions are a collection of interactions that take place on a website within a specified time frame. Each session can include multiple pageviews, events, and other actions taken by a user.
-
Total Users
Total Users metric counts the number of unique users who visited a website or app within a given time period, regardless of how many times they visited or actions they took.
HubSpot Marketing metrics included in this template
-
Blog Views
Blog views is a metric that tracks the number of times a blog post has been viewed by visitors on your website. It helps to measure the effectiveness of your content marketing efforts and the level of engagement with your audience.
-
New Blog Posts Published
The New Blog Posts Published metric in HubSpot tracks the number of freshly added blog posts.
-
Top Blog Posts by Pageviews
Top Blog Posts by Pageviews is a metric that shows which blog posts on a website received the most views from users. It helps identify popular topics and content that resonates with the audience.
Facebook Pages metrics included in this template
- Total Page Likes
Instagram Business metrics included in this template
-
Total Followers
The Total Followers metric is the sum of all the individuals or accounts following an Instagram profile. It is an important measure of a profile's reach and potential audience size.
LinkedIn Company Pages metrics included in this template
-
Followers
Followers metric on LinkedIn Company Pages shows the number of users who have chosen to receive updates from the company. It indicates the reach and engagement potential of the page.
X (Twitter) metrics included in this template
-
Followers
Followers is a Twitter metric that reflects the number of users who have decided to subscribe to a specific account to have access to their posts and updates. It is a reflection of an account's reach and influence on the platform.
SEMrush metrics included in this template
-
Keywords in TOP 10
The Keywords in TOP 10 metric shows the number of organic search keywords for which a domain or URL ranks in the top 10 search results on Google. This helps to assess the search engine visibility and ranking performance of a website.
-
Keywords in TOP 100
Keywords in Top 100 is a SEMrush metric that shows the number of keywords for which a domain or URL ranks in the top 100 search engine results pages (SERPs). It helps to evaluate the domain's or URL's visibility and track SEO performance.
-
Keywords in TOP 20
Keywords in TOP 20 is a SEMrush metric that shows the number of keywords a website ranks for in the top 20 search engine results pages. It helps gauge a website's search visibility and SEO performance.
-
Keywords in TOP 3
Keywords in TOP 3 is a SEMrush metric that shows the number of keywords for which a domain or URL ranks in the top 3 search engine results pages. It indicates a site's visibility and potential traffic from high-ranking and relevant search queries.
-
Estimated Traffic
Estimated Traffic is a metric in SEMrush that shows the estimated monthly search traffic that a particular domain, subdomain, or URL receives from Google's organic search results.
-
Relative Visibility
Relative Visibility is a SEMrush metric that measures a website's visibility compared to its competitors in the same market, based on organic search results and the keywords they rank for.