Uses one-click integrations:
-
 WooCommerce
If you don't use WooCommerce, you can pull data from any of our 130+ one-click, native integrations or from spreadsheets, databases and other APIs.
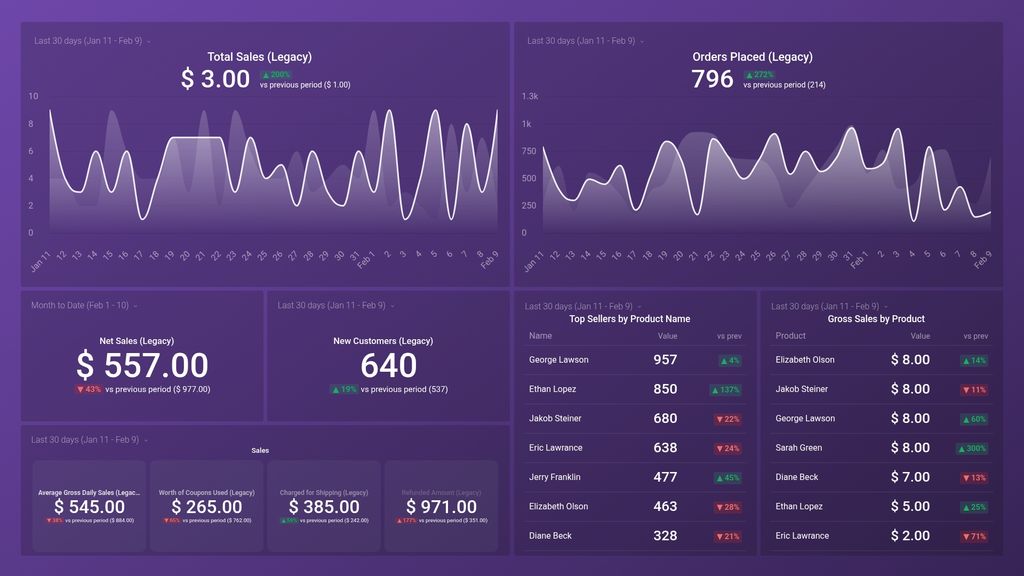
Try this dashboard for freeWhat you’ll learn from this WooCommerce Shop Overview Dashboard template:
Visualize and track your most significant WooCommerce metrics in one dashboard. Find out how your business is performing and what you ought to be focusing on. By connecting your WooCommerce account, you’ll answer the following questions:
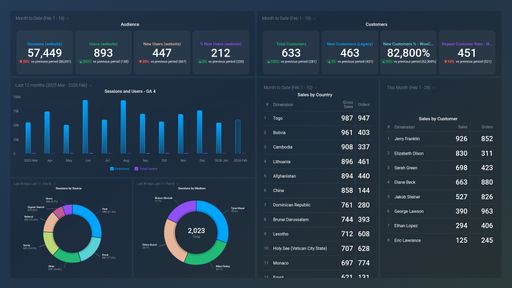
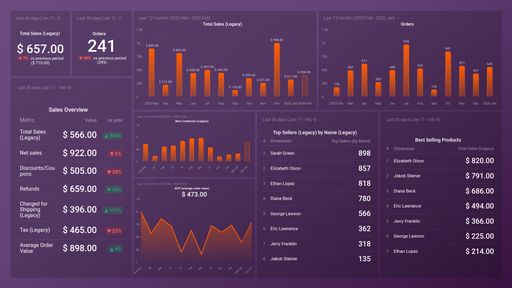
- What’s the total amount of money made from the sale of our products? Find out the monetary value of all sale transactions recorded before deductions over a specified period of time. See how much your online store makes on a daily basis on average from selling its products/services.
- How many orders were placed in the last 30 days from our store? See how many orders you received in the current month and how many orders were placed each day. This data is useful to track as it lets you measure your progress in meeting up with your goal for the month.
- THow many people purchased from our store for the first time? See how many new customers purchased an item from your store in a given month. Compare this data to the previous month. Is your store generating more new customers or not? This will allow you to know how effective your customer acquisition strategy.
- How much are the redeemed coupons worth? See how much all used coupons in a certain month are worth. Compare the value of the used coupons for the current month to that of the previous month to measure the impact of your campaign.
- What are my top-selling products? Find out which products are your best sellers and how many of these items were bought by your customers in a certain month.
- How much do we get charged for shipping and taxes? Find out how much your e-commerce business is being charged for shipping and taxes at any given point in time.
Dig deeper into your store’s data using our deep integration with WooCommerce.
What else can you track and visualize with our deep integration with WooCommerce? When it comes to measuring your online store’s performance, just about everything:
-
- Abandoned cart rate
- New vs. returning customers
- Low inventory products
- Refunded items and orders
- Average net daily sales
- Taxes, and more.
Read more about Databox’s WooCommerce integration.
Explore more WooCommerce dashboards.
WooCommerce metrics included in this template
-
Average Gross Daily Sales (Legacy)
The Average Gross Daily Sales metric is the average total revenue generated by a store in a single day, including taxes and discounts.