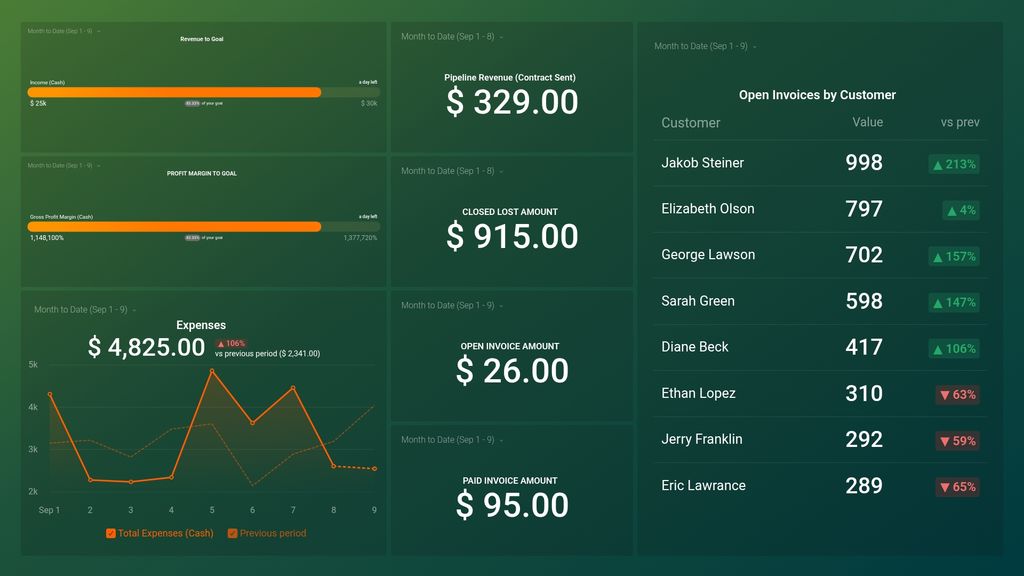
What you’ll learn from this QuickBooks + HubSpot CRM: Financial Performance Dashboard Template
Connect your Quickbooks and HubSpot accounts and learn:
- How do I track open invoices in Quickbooks? Keep track of all open invoices for individual clients, and see which customers have been billed but are yet to pay. Also, view the total amount of money you’re owed by your clients anytime, anywhere. By tracking your open invoices, you’ll be able to stay on top of your business’s cash flow and turnover.
- How much did I get from my paid invoices? View the total amount you got from all paid invoices during a given time period. By tracking this information, you’ll be able to tell if some of your clients made partial payments, and at the same time, manage the possible harm this might cause your business’s cash flow.
- Am I on track to hit my revenue goal for the quarter? Track your progress towards your set revenue goal(s) daily, weekly, or monthly. Use this data to assess your overall business health, and determine if you’re making progress toward your long-term financial goals.
- How do I measure my company's earnings relative to its revenue? Keep an eye on your business’s gross profit margin at any given time. Find out if your business is generating more profits over costs as planned. Use this data to evaluate your company’s health and make better business decisions for your business.
- How do I track my expenses? Track and manage your business expenses daily, weekly, and monthly. Tracking your business expenses helps you see exactly where your money goe. It also helps cut down on wasteful spending and be better prepared for tax season.
Pull additional data using our deep integration with HubSpot CRM.
What else can you track and visualize with our integration with HubSpot CRM? When it comes to leads, sales & revenue, almost anything:
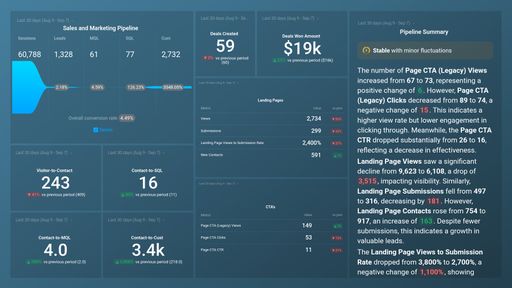
- Sales pipeline and leaderboards
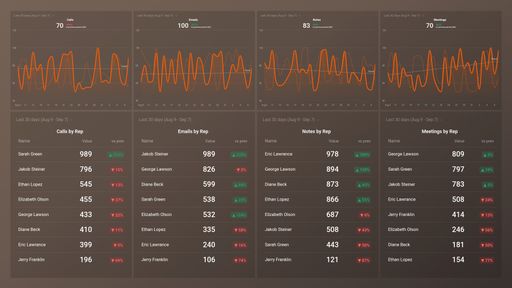
- Calls and meetings booked
- Meetings by owner
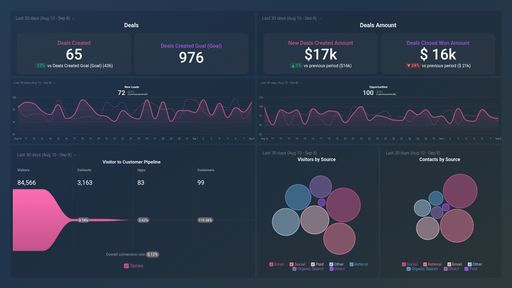
- Deals by stage
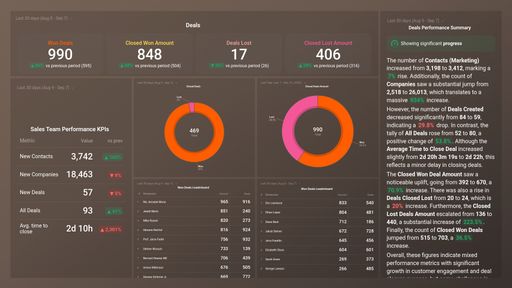
- Closed Won (and lost) deals
- Sales activity by sales rep, and more
In Databox, you can quickly visualize 100s of HubSpot metrics in various ways, alongside all the important metrics from other data sources you’re using.
Read more about Databox’s HubSpot CRM integration.
Explore more QuickBooks dashboards and HubSpot CRM dashboards.
Pull additional data using our robust integration with Quickbooks.
What other financial metrics can you track and visualize with our integration with Quickbooks? Almost anything:
- Cash flow forecast
- Customer balance
- Income & Sales by customer
- Purchases by vendors
- Inventory valuation
- Budget & forecasting
In Databox there are dozens of Quickbooks metrics already built and ready for you to visualize in a variety of different ways. With Query Builder and Data Calculations, the range of different metrics and metric combinations you can track from Quickbooks widens.
Read more about Databox’s Quickbooks integration.