
Track all of your key business metrics from one screen
GET STARTED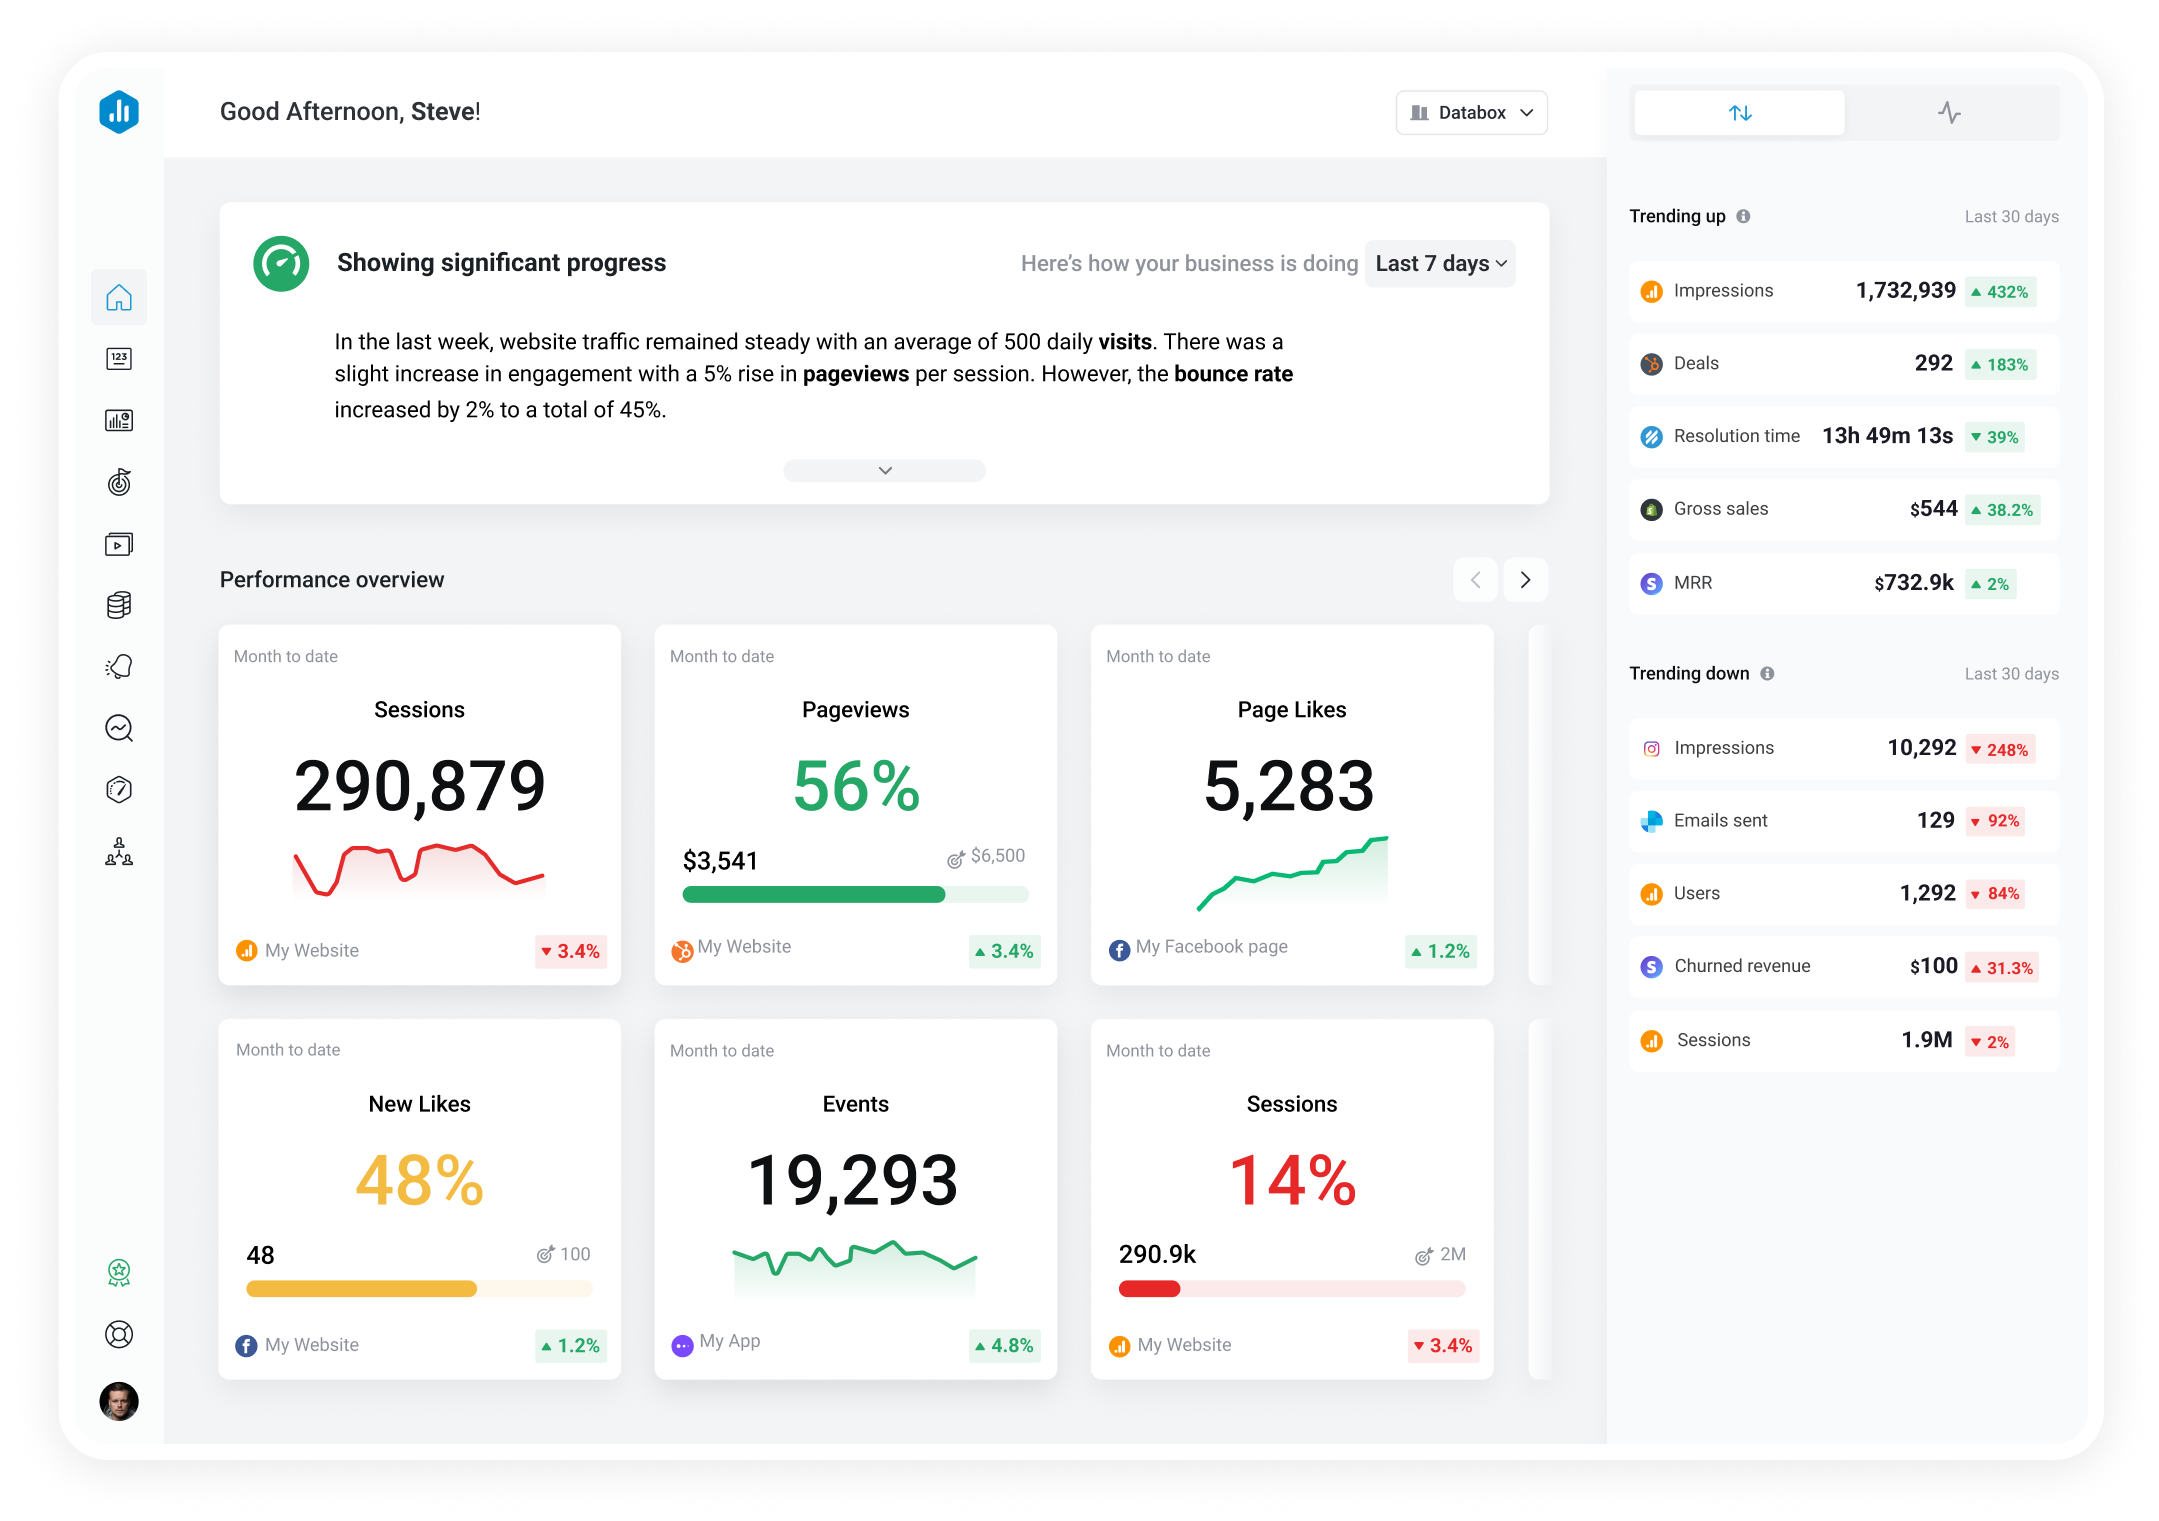

 Google Analytics 4
Sessions by Landing Page + Query String
Google Analytics 4
Sessions by Landing Page + Query String The Sessions by Landing Page + Query string metric measures the number of sessions that start with a specific page on a website, providing insights into which pages are most effective at attracting visitors.
With Databox you can track all your metrics from various data sources in one place.

Used to show comparisons between values.
Databox is a business analytics software that allows you to track and visualize your most important metrics from any data source in one centralized platform.
To track Sessions by Landing Page + Query String using Databox, follow these steps:
 Goals
Goals Scorecards
 Metric Digest
 Metric Builder
 Data Calculations
 Performance Screen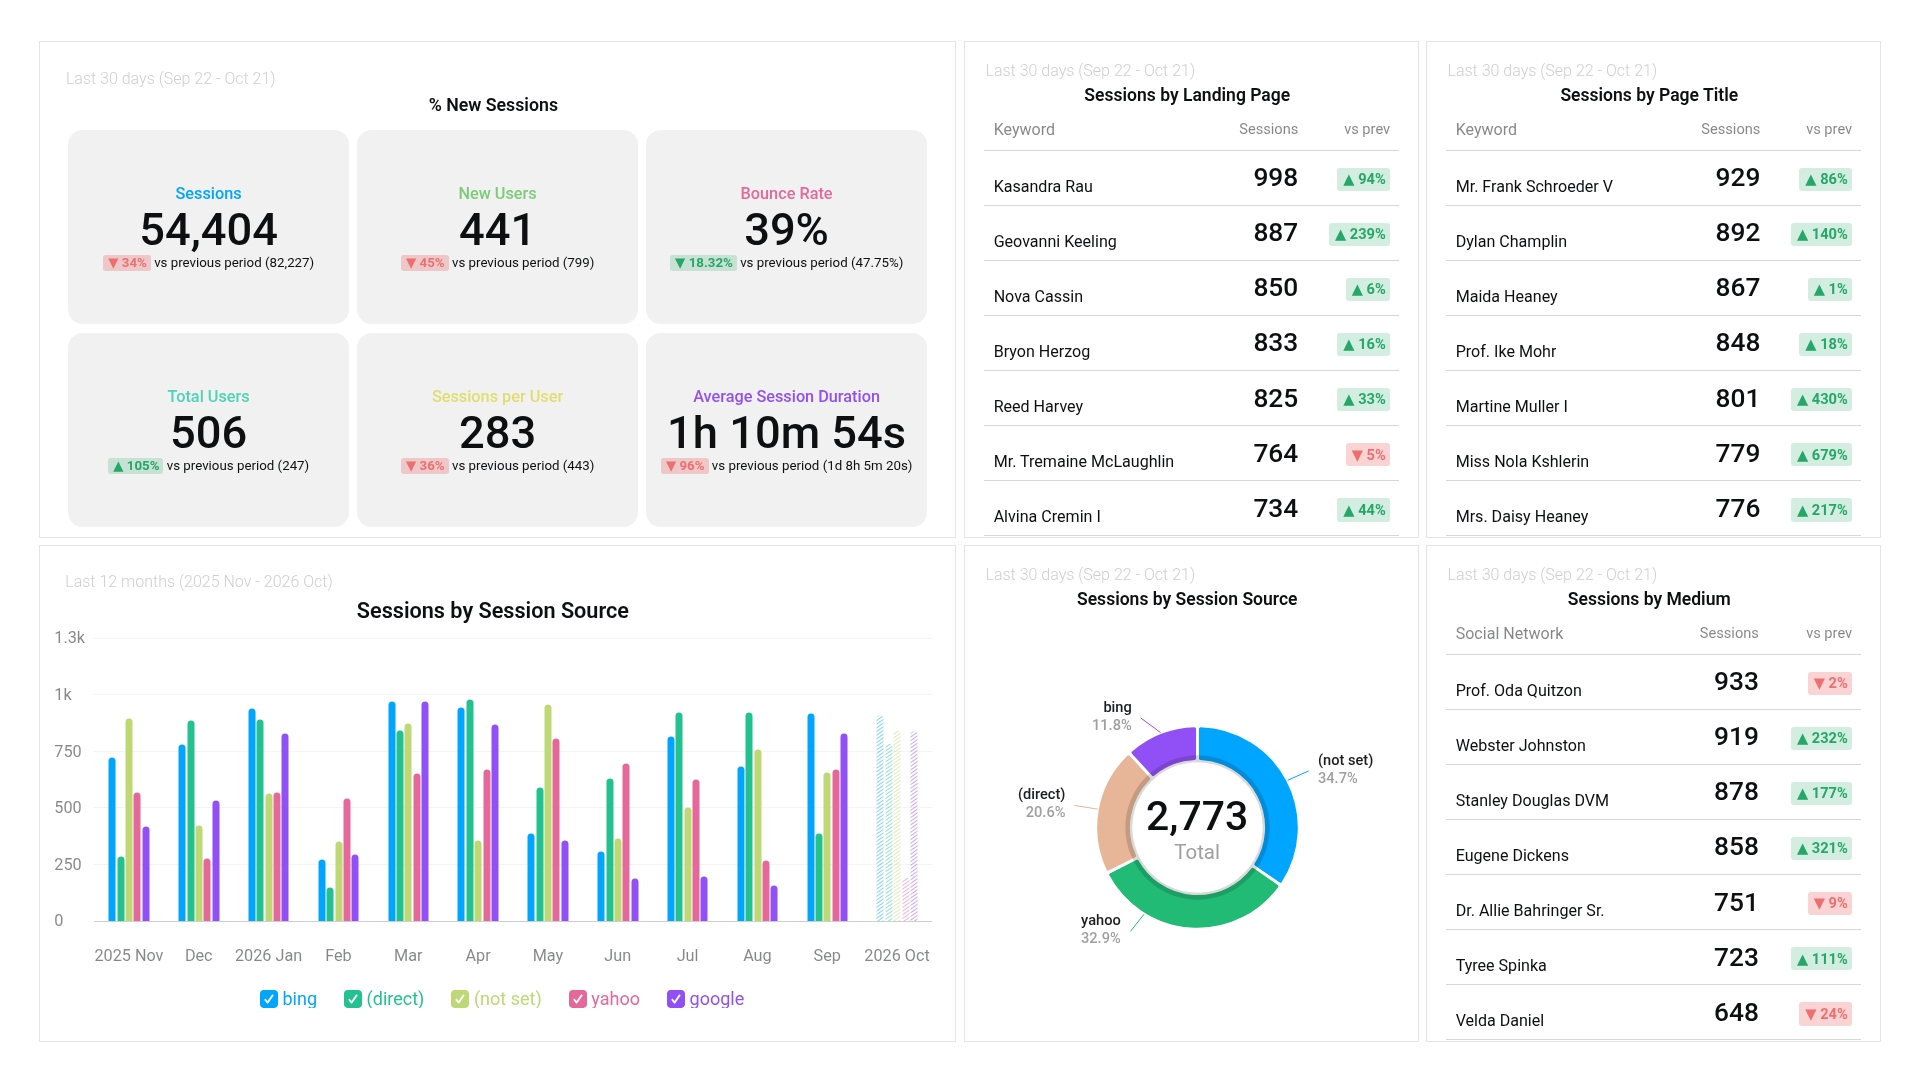
Google Analytics (Acquisition) dashboard template goes deeper into your Sources and reveals which marketing campaigns have been most productive.
Google Analytics 4
The Sessions by Session Default Channel Group metric in Google Analytics 4 reports the number of sessions attributed to each default channel group, which categorizes traffic sources such as organic search, social media, paid search, and direct traffic.
Google Analytics 4
Engaged Sessions by Medium is a Google Analytics 4 metric that shows the number of sessions where users were engaged, based on specific mediums like paid search, organic search, social media, and others. It measures the quality of sessions and helps determine the effectiveness of each medium in driving user engagement.
Google Analytics 4
Conversions is a performance metric that measures the number of times visitors complete a desired action on your website, such as a purchase, form submission, or app installation. It helps you track the effectiveness of your marketing campaigns and optimize your website to increase conversions.
Google Analytics 4
ARPPU by Event is a Google Analytics 4 metric that calculates the average revenue per paying user, specifically for the chosen event. It helps to measure the effectiveness of revenue-generating events and optimize them for higher returns.
Google Analytics 4
The Event Value by Source metric in Google Analytics 4 measures the total value generated by events grouped by the source. It helps you identify which sources are driving the most valuable actions on your website or app.
Google Analytics 4
The Sessions per User metric in Google Analytics 4 shows the average number of sessions per user during a specific time period. It indicates how frequently users are returning to the website and engaging with its content.
Google Analytics 4
Total Revenue by Event is a metric that tracks the total amount of revenue generated from specific events, such as purchases or subscriptions, on a website or app.
Google Analytics 4
Total Users metric counts the number of unique users who visited a website or app within a given time period, regardless of how many times they visited or actions they took.