Uses one-click integrations:
-
 TikTok Ads
If you don't use TikTok Ads, you can pull data from any of our 130+ one-click, native integrations or from spreadsheets, databases and other APIs.
Try this dashboard for freeWhat you can learn from this TikTok Ads Account Overview Dashboard Template
Connect your TikTok Ads account and you’ll learn:
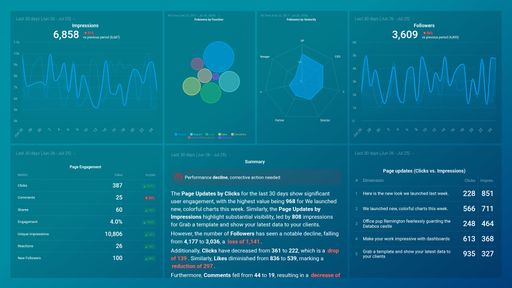
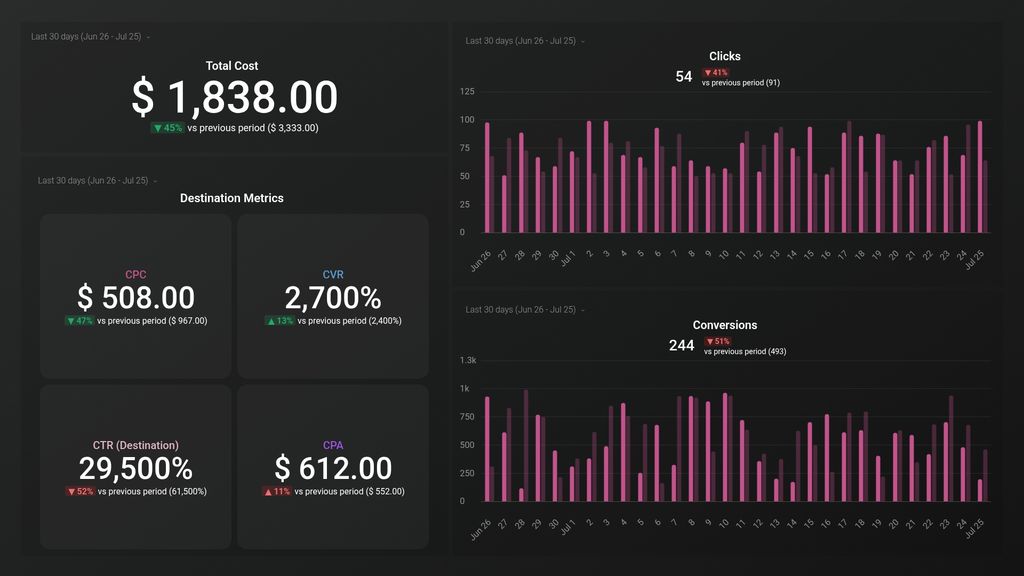
- How do I measure the performance of my TikTok Ads campaign? Track and compare your most important TikTok Ads metrics at a glance to better understand the business impact your ads are driving. Some of these metrics include average Click-through Rate (number of people that clicked on your ad after seeing it), average Cost-Per-Click (how much you pay for a click on average), and so on.
- How many clicks do our ads receive? Measure the total number of ad clicks your campaigns are receiving over a given time period and have a better understanding of the content that resonates best with your audience.
- Are our ad campaigns under or over budget? Easily keep every campaign within budget by monitoring the amount you’ve spent over any given time period. Compare the amount you’re spending to previous periods to measure the growth and efficiency of your program.
- How many conversions are your TikTok ads having Measure the overall conversions of your ad campaigns. If you are not seeing the desired number of conversions in your campaign, make real time changes to your strategy and see if there is a visible improvement.
Pull additional data using our deep integration with TikTok Ads.
What other campaign metrics can you track and visualize with our integration with TikTok Ads? Almost anything:
- Individual campaign and ad performance
- Clicks, downloads, leads, and sales
- Cost per impression (CPM), click (CPC), and lead (CPL)
- Return on ad spend (ROAS)
- Ad spend and overall budget
- Progress towards your campaign goals, and more
In Databox there are almost 100 TikTok Ads metrics already built and ready for you to visualize in a variety of different ways. With the use of Metric Builder and Data Calculations, the range of different metrics and metric combinations you can track from TikTok Ads widens.
Read more about Databox’s TikTok Ads integration.
Explore more TikTok Ads dashboards.
TikTok Ads metrics included in this template
-
CTR
Click-through rate (CTR) measures the number of clicks an ad receives divided by the number of times the ad is shown. It is a crucial metric to determine the effectiveness of an ad campaign.
-
Conversion
The Conversion metric measures the number of desired user actions taken on an ad, such as making a purchase or filling out a form, in relation to the number of ad impressions or clicks. It indicates the effectiveness of an ad in driving valuable actions and helps optimize ad campaigns for better results.
-
CVR
CVR or Conversion Rate is the percentage of users who take a desired action after seeing an ad. It serves as a measure of ad effectiveness and helps in optimizing ad campaigns to increase conversions.
-
CPC
CPC stands for Cost Per Click. It's a metric used in digital advertising to calculate how much you're paying for each click on your ad. The cost is calculated by dividing the total cost of the campaign by the number of clicks received.
-
CPA
CPA stands for Cost Per Acquisition. It is a metric used in TikTokAds to measure the total cost of acquiring a customer. It is calculated by dividing the total cost of the ad by the number of conversions, such as a purchase, sign-up, or download. A lower CPA suggests that the ad campaign is more effective in acquiring customers.
-
Clicks (All)
The sum of all clickable interactions on your ads, including clicks led to advertiser-specified destinations and non-destination clicks from social actions and interactive experiences during the specified Date Range.
-
Total Cost
Total Cost is the sum of all costs associated with running a TikTok Ads campaign, including ad spend, platform fees, and any additional expenses incurred. It helps measure the overall investment required for a campaign and its profitability.